What Predicts an AI Citation Is Not What Proves Yours
DiscoveredLabs measured 2 million AI citations and found what correlates with getting cited. Correlation across pages you don't own isn't proof for yours.
Citon22 min read
Short answer
Does a large correlational study prove what will get your specific page cited by AI?
No. A large correlational study, however rigorous, measures which features associate with citations across thousands of pages it does not control. It cannot isolate what caused any single page, including yours, to be cited or skipped, because it never withholds a comparison group. Proving that requires a second instrument entirely: a held-out control run against your own pages, a set of queries deliberately left unworked across the same window, so whatever the model would have done on its own can be subtracted from whatever changed. A regression tells you what predicts a citation on average. A controlled test tells you whether your specific work caused one.
DiscoveredLabs spent 6 months and 2 million AI citation observations answering a question every AEO buyer already has an opinion on: what actually gets a page cited by ChatGPT, Claude, Google AI or Gemini. The methodology is real, the sample is large, and the finding at the top, prompt-content alignment as the dominant predictor, is worth taking seriously. It is also, by construction, a different kind of claim than the one most buyers reading it actually need answered. A study of 10,000 pages nobody at your company owns can tell you what correlates with getting cited. It cannot tell you whether the change you are about to make to your own page will cause anything at all.
That distinction sounds academic until it is the one thing standing between a buyer and a wasted quarter. A vendor pitch built entirely off DiscoveredLabs's coefficients would tell a client to rewrite their FAQ, tighten prompt-content alignment across the site, and check back next quarter to see the citation count rise. If it rises, the pitch looks vindicated. It would look exactly as vindicated if the client had done nothing at all and the model's own citation behavior simply drifted over that same quarter, because nothing in a cross-sectional regression run once, on a population the client is not part of, can tell the two apart after the fact. This piece is not a rebuttal of DiscoveredLabs's findings. It is an argument that the findings answer a prioritization question well and a proof question not at all, and that buyers paying for AEO work need both answers, not just the first one.
What the DiscoveredLabs study actually measured
DiscoveredLabs's "What Drives AI Citations" is a cross-sectional regression study: 2 million citation observations collected over 6 months, spanning ChatGPT, Claude, Google AI and Gemini, resolved down to 10,000 distinct cited URLs and more than 60 engineered features covering structure, alignment, recency and infrastructure. The team ran 9 separate robustness checks against every reported finding, multilevel regression with domain fixed effects, False Discovery Rate correction, stability-selection Lasso across 200 bootstrap samples, double machine learning for orthogonalized effects, factor analysis on collinear predictor groups, generalized additive models for non-linear relationships, sensitivity analysis across five subset definitions, leave-one-domain-out replication across the top eight domains, and a temporal hold-out validation comparing March against April. A finding had to survive at least 4 of the 9 checks before it made the report. That is a serious amount of work spent making sure a correlation is not an artifact of one model, one month, or one dominant domain.
At a glance
What the coefficient hierarchy says, and what it does not
| Question a buyer actually has | What DiscoveredLabs's regression answers |
|---|---|
| Which page-level signal correlates most with a citation | Prompt-content alignment, standardized coefficient +0.37, roughly 3x the next-largest page signal. |
| Will adding an FAQ, a TLDR or an author bio move a specific page | Each carries a real but much smaller coefficient (+0.07, +0.05, +0.02). A domain-level lever outweighs all three combined by roughly 6x. |
| Does the study show what caused any one page's citations to change | No. A population-level coefficient describes an average association across 10,000 pages the study does not control, not a controlled test of one page. |
| What would show that | A held-out control, queries deliberately left unworked across the same window, so the answer can be compared against what would have happened with nobody working the page. |
None of those 9 checks change what kind of question a regression can answer. Every one of them tests whether an association holds up under a different statistical lens, domain fixed effects, a different bootstrap sample, a different month. None of them withholds treatment from a control group and compares the two, which is the one design that actually separates "this feature is associated with getting cited" from "this feature caused this page to get cited." That distinction is not a criticism of the study. It is a description of what a cross-sectional design can and cannot do, stated by the people who ran nine checks specifically because they understood the risk of overclaiming from a design like this one.
It is worth being precise about what each check actually buys, because the nine of them are not interchangeable. FDR correction and stability-selection Lasso across 200 bootstraps both guard against the same failure mode, a feature looking significant purely because 60-plus features were tested at once and one of them was bound to clear a p-value threshold by chance. Double machine learning and the factor analysis on collinear predictor groups guard against a different failure, two correlated features splitting credit for the same underlying signal in a way that makes both look weaker or stronger than either actually is. Leave-one-domain-out replication and the temporal hold-out comparing March against April guard against a third failure, one outsized domain or one unusual month driving a result that would not survive contact with a different slice of the same data. All three failure modes are real, all three are worth guarding against, and guarding against all three at once is exactly why 9 checks were warranted rather than one. None of the three is the failure mode a held-out control exists to catch, which is a fourth, separate problem: the population moving on its own, for reasons that have nothing to do with any feature in the model, between the moment a page is measured and the moment its citation count is checked again.
What Predicts a Citation Most? The One Signal That Dwarfs the Rest
Prompt-content alignment, how closely a page's actual content matches the specific prompt a user asked, is the strongest predictor DiscoveredLabs found by a wide margin: a standardized coefficient of +0.37 (95% CI +0.33 to +0.41), roughly three times larger than the next-strongest page-level signal, which the study translates to about a 30 percent increase in citation likelihood per standard-deviation rise in alignment. Everything else measured on the page itself trails a long way behind. FAQ sections carry a coefficient of +0.07, TLDR or BLUF blocks +0.05, author bios +0.02. Core Web Vitals, Lighthouse scores and schema markup showed no significant independent effect once the other features were controlled for.
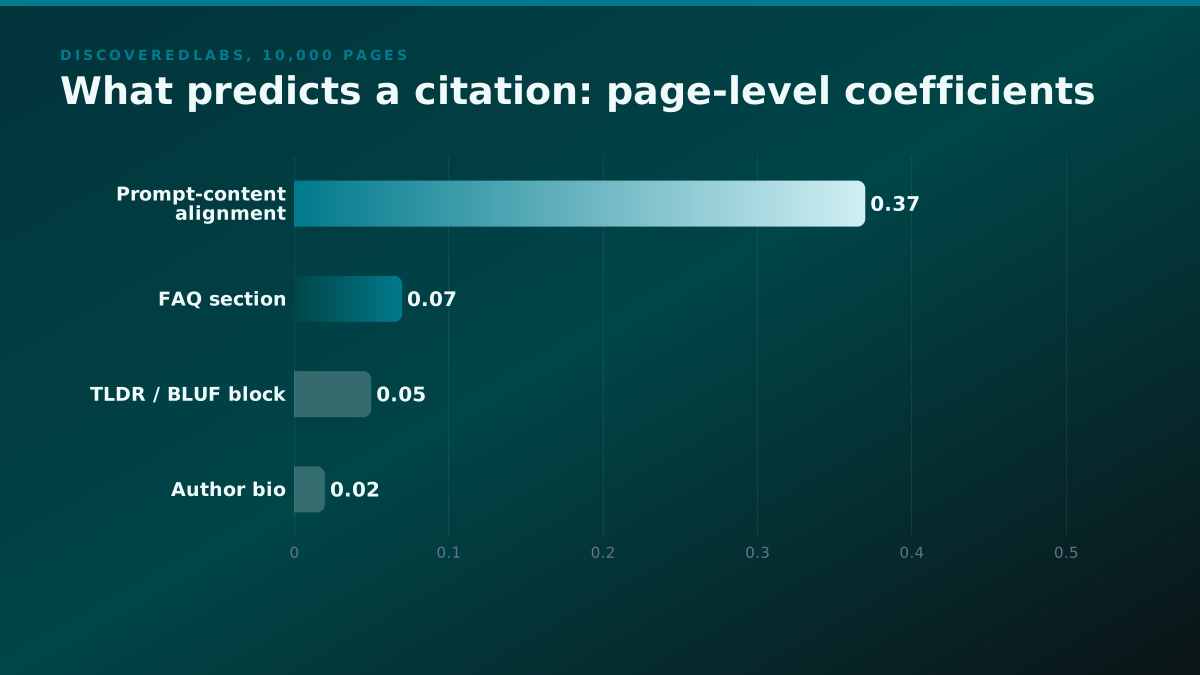
A coefficient describes what moved together across ten thousand pages somebody else owns. It has never once described what would happen to the one page you are about to edit.
Read plainly, this is a genuinely useful ranking of levers: write content that actually answers the specific question being asked, and every structural add-on a checklist would tell you to bolt on afterward is a rounding error by comparison. Read as proof that your own page's citation count will move if you add an FAQ block, it says something the study never claims. A coefficient of +0.07 describes an average association across 10,000 pages controlled for domain effects. It does not describe what happens to one specific page when one specific person adds one specific FAQ section to it next Tuesday. The gap between those two readings is exactly where most of the AEO checklist industry lives.
Where the four engines disagree
The study's engine-level breakdown is where "AI citations" stops being one target and starts being at least four different ones, each with its own behavior. Median cited-content age varies by close to three months across engines: Claude's median cited page is 5.1 months old, Google AI's is 6.0 months, Gemini's is 7.8 months, and ChatGPT's is 8.0 months, roughly 57 percent older than Claude's.
Median age of cited content, by engine
| Engine | Median age of cited content |
|---|---|
| Claude | 5.1 months |
| Google AI | 6.0 months |
| Gemini | 7.8 months |
| ChatGPT | 8.0 months |
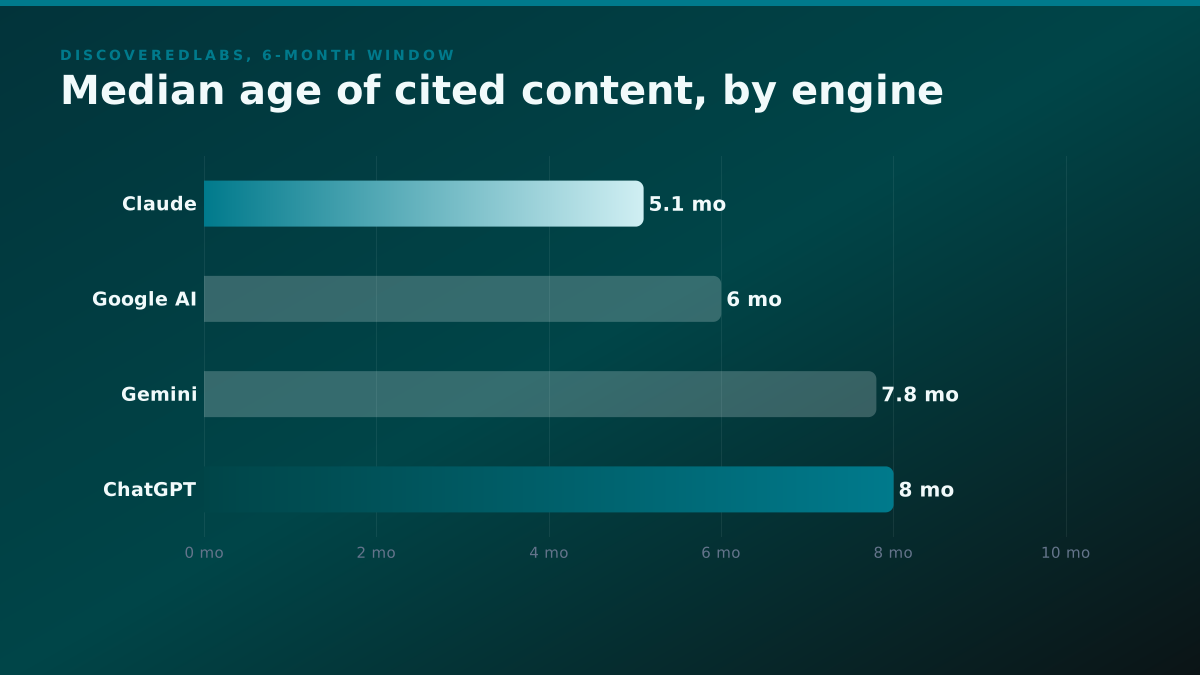
That gap has a direct operational consequence: a page published or meaningfully updated 6 months ago is well inside Claude's typical citation window and only marginally inside ChatGPT's, holding every other feature of the page constant. A publishing cadence tuned to one engine's apparent preference for freshness will read as roughly correct on Claude and roughly stale on ChatGPT, and neither engine will tell you which one it is being.
The gap is large enough that it should change how a content-refresh calendar gets built, not just how it gets read afterward. A team refreshing its highest-value pages once every 6 to 8 months is roughly matching ChatGPT's median cited-page age and running noticeably behind Claude's, which is closer to a 5-month cycle before the typical cited page there has already aged past what Claude tends to prefer. Neither cadence is wrong in isolation. A team that picks one refresh interval and applies it uniformly across every engine it wants to be cited in is optimizing for the slowest-moving engine by default and quietly under-serving the fastest one, without any dashboard telling them that is what happened.
Brand-controlled citation share diverges even more sharply than recency does. DiscoveredLabs found that ChatGPT draws 39 percent of its unique cited URLs from brand-controlled domains, while Gemini draws only 14 percent from the same category, preferring third-party and independent sources by a wide margin. A brand whose AEO strategy leans entirely on its own site content is working with roughly the grain of ChatGPT's citation behavior and mostly against the grain of Gemini's, again without either engine surfacing that difference anywhere a buyer would naturally look for it.
Put the two engine-level findings together and a single-engine measurement program starts to look like a category error rather than a simplification. A team that checks "are we cited" against one model, most commonly whichever one their own team happens to use daily, is sampling one point from a distribution that DiscoveredLabs shows varies by roughly 3 months in recency preference and by nearly 3x in how much weight it gives brand-owned content. Two teams running the identical AEO program, one measured against ChatGPT and one against Gemini, could reasonably report different results from the same underlying work, not because the work behaved differently but because the instrument they pointed at it has a different bias built in. A measurement program that reports a single blended number across all four engines is averaging over that divergence rather than resolving it, which is a second, quieter reason a single visibility score undersells what is actually happening beneath it.
Format outperforms most of what buyers optimize first
DiscoveredLabs's format-level findings put a number on something practitioners have argued about anecdotally for a while: pricing pages carry a coefficient of +0.39, close to the size of the prompt-content alignment effect itself, while listicle-style reviews carry -0.12, an actively negative association with getting cited. A commercial page stating a real number a buyer can act on outperforms a roundup comparing several options in vague terms, by a wide enough margin that the two formats are effectively pulling in opposite directions.
A practitioner reading of a related pattern lines up with that finding without having seen DiscoveredLabs's numbers directly. Alex Groberman's read of what separates brands ChatGPT and Claude actually recommend frames it as a single dominant trait rather than a checklist, the kind of observation that a +0.39 versus -0.12 coefficient gap would produce if you were watching enough real citations to notice the pattern without running the regression yourself.
The mechanism is not mysterious once the alignment finding above is taken seriously. A pricing page answers a specific, narrow, high-intent prompt ("how much does X cost") about as directly as a page can answer anything. A listicle answers a broader prompt ("what are the best options for X") with a survey of several answers at once, which is a structurally weaker match to any single prompt a user actually typed. Format and alignment are not two separate findings; format is a proxy for how tightly a page's content can possibly match a specific prompt before a single word of the copy is written.
There is a second reading of the -0.12 listicle coefficient worth stating plainly, because it cuts against a large share of what currently gets published under the AEO label. A ranked "best of" roundup is, structurally, a page trying to be the answer to many different prompts at once, which is close to the opposite of what the +0.37 alignment finding rewards. The practical implication is not that listicles never get cited (they clearly do, at a lower rate) but that a content calendar built mostly around comparison and roundup formats is optimizing for a format the study's own numbers say works against citation likelihood, while a narrower page built to answer one specific, well-defined question is optimizing with the grain of the strongest finding in the whole dataset. DiscoveredLabs's own research page is itself an instructive example: a single, narrow, deeply specific answer to one question, not a roundup of ten AEO vendors compared against each other, and it is the shape of page its own coefficients say should win.
What a 2-million-row regression can prove, and what it cannot
Every one of DiscoveredLabs's 9 robustness checks makes the correlational finding more trustworthy as a correlational finding. None of them converts it into a causal one, and the study's own design does not claim otherwise. The distinction is not academic hair-splitting. Kohavi, Tang and Xu's Trustworthy Online Controlled Experiments lays out why: a regression, however carefully controlled for confounders, describes what happened across a population it observed but did not manipulate. A held-out control, a comparison group deliberately left untreated across the same window, is the only design that lets you subtract out everything that would have happened anyway and isolate what your own intervention actually changed. No amount of additional data or additional robustness checks substitutes for that missing control arm, because the question a control answers ("what would have happened without this change") is not a question a bigger sample can answer on its own.
The confound this matters for is not hypothetical, and it is the same one a buyer runs into at the individual-page level, just stated at population scale. Two independent lines of evidence show that a single reading of AI citation behavior, or a cross-sectional snapshot across many pages at one point in time, is noisier than it looks. SparkToro and Gumshoe measured under a 1-in-100 chance that two identical prompts return the same brand list on a corpus unrelated to either DiscoveredLabs's sample or our own. Separately, Atil and colleagues measured up to 15 percent accuracy variation across ten runs at temperature zero, across five models and eight tasks, evidence that the instability sits in the infrastructure itself rather than in a setting anyone forgot to disable. A model whose own answers move that much between identical asks will also move a domain's measured citation rate between two snapshots taken a month apart, for reasons that have nothing to do with any specific page-level change made in between. A regression run across a single 6-month window cannot distinguish "the model's own behavior drifted" from "the pages genuinely got better," because it never ran the comparison that would tell the two apart.
The buyer's question was never "what predicts a citation on average." It was "did my page get cited because of what I changed," and a cross-sectional study was never built to answer that question for a single page.
Put concretely: imagine a domain's measured citation rate genuinely rose 8 percentage points over the same 6-month window DiscoveredLabs studied, and a vendor points to that rise as proof their AEO retainer worked. DiscoveredLabs's own robustness checks would not catch the problem with that claim, because the checks operate on the regression's coefficients, not on this one domain's before-and-after story. What would catch it is the exact design the checks do not include: a held-out set of pages on that same domain, left deliberately untouched by the vendor's work across the identical window, checked against the treated pages at the end. If the untouched pages rose by a similar amount, the 8-point rise was never the vendor's signal, it was the model's own drift, the same drift SparkToro and Atil's numbers describe from two different angles. If the untouched pages stayed flat while the treated ones rose, the vendor has something closer to actual evidence. DiscoveredLabs's study cannot distinguish these two domains from each other, because distinguishing them was never the question a 10,000-page cross-sectional sample was designed to answer.
What Do We Run Instead? A Held-Out Control on the Queries That Matter
This is where our own measurement work is a complement to DiscoveredLabs's study rather than a competitor to it, because it is built to answer the specific question their design cannot: not "what predicts a citation across 10,000 pages," but "did a controlled test on our own pages show a difference a control group did not also show." We have published two runs so far, both with their numbers and both stated at the edge of what they actually support.
The first is a step-zero measurement: 12 money queries, the kind a real buyer would actually type, repeated 5 times each against one model on one day. All 60 of 60 calls succeeded. 7 of the 12 queries flipped their outcome across repeats that were, by construction, identical: the same query asked five times, with no intervention anywhere in between, and more than half the queries did not return the same answer twice. That result alone is the practical argument for a control group stated in numbers rather than in theory: if a query flips outcome across five identical asks with nothing changed, a single before-and-after reading of that same query cannot tell you whether an intervention worked, because the "before" and "after" readings were never guaranteed to agree with each other even without any intervention at all.
The second run is a permutation test built to quantify exactly that baseline noise: 20,000 random splits of the same 12-query set, with no intervention applied to either half in any split. The null difference this produced centred on zero, as it should with nothing being tested, with a mean of +/-0.0016 and a standard deviation of 0.215. That standard deviation is the number that actually matters to a buyer deciding whether to trust a reported score: it is the size of the swing you should expect to see between two readings of the identical, untouched query set, purely from the system's own variability, before a single dollar of AEO work has been spent.
What this is not is a completed causal-lift result, and understating that would make the same mistake this whole piece is arguing against. The 12-query, 5-repeat design's own power analysis puts the minimum detectable lift at 51.1 percentage points, roughly 4 times underpowered against a 40-query, 40-repeat design that would bring the detectable floor down to 9.9 percentage points, a size closer to what a real AEO engagement should be expected to move. We have not yet run that larger design. What we have run is the step that has to come before it: measuring how much a metric moves with nobody touching it, which is the number every reported lift has to clear before it means anything at all.
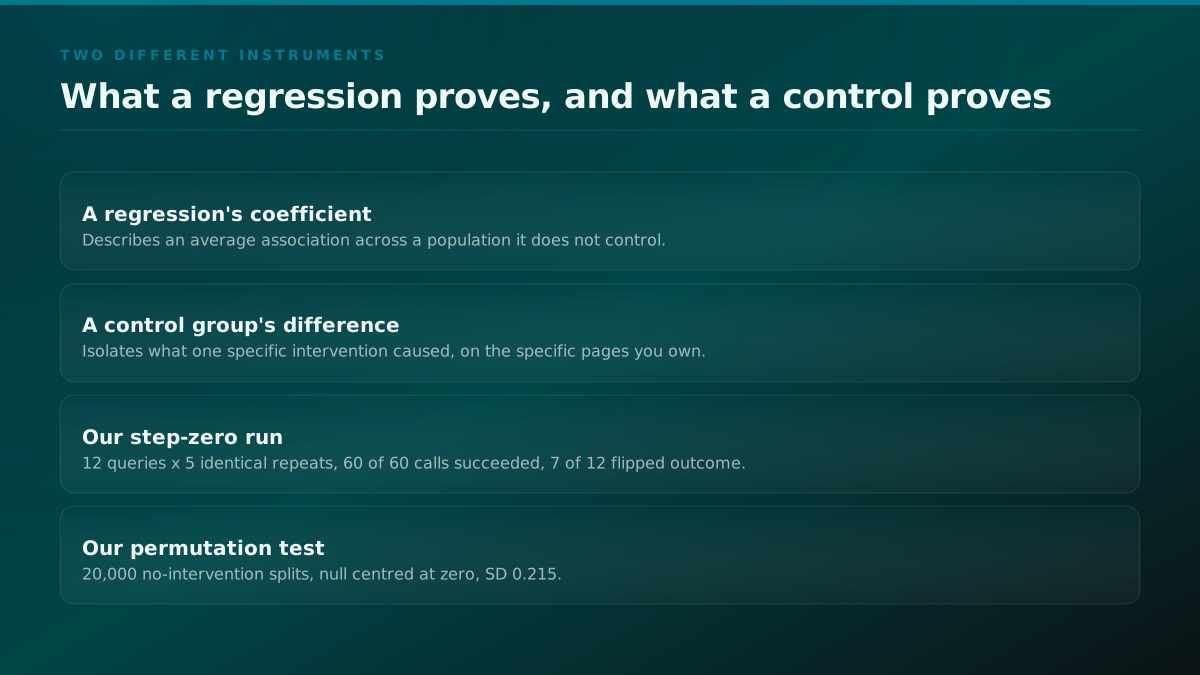
That sequencing is deliberate, not a shortcut taken because the larger design is harder to run. A team that skips straight to a 40-query, 40-repeat causal test without first measuring the baseline noise on its own query set has no way to know whether a detected difference is real or is simply within the range the null distribution already produces on its own. Our permutation test's standard deviation of 0.215 is that baseline for our own 12-query set specifically; a different query set, a different vertical, or a different model would produce a different number, which is exactly why the step has to be run again for every new engagement rather than assumed from a published constant. This is also the concrete difference between our method and a visibility dashboard's rolling score: a dashboard reports the level, this quarter's count against last quarter's, and treats a step-zero noise characterization as optional overhead. We treat it as the first deliverable, because a level with no noise floor attached is a number nobody can actually act on.
The design once scaled to 40 queries and 40 repeats runs the same way, just larger: a held-out set of queries and pages left deliberately untouched across the engagement window, sitting alongside the treated set our work actually targets, both measured at the same cadence, both subject to the same permutation test at the end to establish whether the gap between them exceeds what the null distribution alone would produce. A result that clears that bar is evidence the work caused the difference. A result that does not is evidence it did not, stated plainly rather than rounded into a success metric regardless of what the control group shows. That second outcome is uncomfortable to report and is exactly the outcome DiscoveredLabs's population-level regression has no mechanism for ever producing, because a regression run once, with no control arm, cannot fail in that particular way. It can only ever report a coefficient, and a coefficient always looks like progress.
The question a buyer is actually asking
Nobody evaluating an AEO spend is actually asking "what predicts a citation across a 10,000-page sample I do not own." They are asking whether their own page, their own edits, their own retainer caused a specific number to move, and DiscoveredLabs's study, for all 9 of its robustness checks, was never built to answer that question for any single page. It is built to answer a different one well: what to prioritize, in what order, before you have run any measurement of your own. Prompt-content alignment first, format second, domain authority as the ceiling that page-level work operates under, and everything else a distant, real, but comparatively minor lever.
Answering the causal question needs the second instrument: a control that tells you what your own untouched pages would have done anyway, run against answer engine optimization work on the specific pages you actually care about, not a 10,000-page sample somebody else assembled. We wrote up our other reporting on AI citations and on AI-citation measurement specifically in more depth elsewhere on this site, and the step-zero numbers above are the current state of measuring answer engine optimization lift against that bar, stated honestly rather than rounded up to a headline that does not survive its own null test. Our pricing reflects that this is measurement work billed on the engagement, not a subscription to a dashboard reporting the same uncontrolled number back to you every week.
A buyer who has read this far already has the one question worth asking any vendor reporting a rising citation score: what would that same number have read with nobody working the account. If the answer is a shrug, the number being reported was never evidence of anyone's work in the first place, DiscoveredLabs's coefficients included.
Two follow-up questions are worth asking alongside it, both drawn directly from the gaps this piece has walked through. First, which engine is the reported number measured against, and does the vendor's program account for the fact that ChatGPT, Claude, Google AI and Gemini disagree on recency and on brand-controlled citation share by a wide enough margin that a program tuned to one will read differently on another. Second, how many times was each query actually asked before the number was computed, because a single ask per query carries close to no information about what the underlying system does on average, and a vendor who cannot answer that question has likely never run the check themselves.
None of this makes DiscoveredLabs's work less valuable as a prioritization guide, and nothing here argues for skipping the page-level and format work their coefficients point to while waiting on a controlled test to finish. The two are sequential, not substitutes: prioritize with the regression, verify with the control, and do not let either stand in for the other in a report a buyer is trusting with real budget. Prompt-content alignment first, format second, an honest accounting of the domain-authority ceiling third, and FAQ or TLDR treatment as a real but minor lever after that, is a genuinely useful order of operations for anyone deciding where to spend the next quarter of AEO work. What it is not, and what no cross-sectional regression across a population you do not control could ever be, is proof that the specific quarter of work you are about to buy caused the specific number you will be shown at the end of it. That proof takes a control group, stated plainly, run on the pages that are actually yours, measured against a baseline noise floor established before any work begins rather than assumed away afterward.
That distinction is what makes the timeline question harder than it looks. How long this takes to work is really two clocks, and quoting the fast one as though it were the slow one is the most common way the answer gets given badly.
Sources
Every number above, and where it came from. A figure without a row here is one we should not have printed.
- DiscoveredLabs, "What Drives AI Citations"
- 2 million AI citation observations over 6 months across ChatGPT, Claude, Google AI and Gemini, 10,000 cited pages, 60+ engineered features, 9 robustness checks including multilevel regression with domain fixed effects, FDR correction, stability-selection Lasso across 200 bootstraps, double machine learning, and temporal hold-out validation. A finding had to survive at least 4 of the 9 checks to be reported.
- Our own step-zero measurement run
- 12 money queries times 5 identical repeats, one model, one day, 60 of 60 calls succeeded, 7 of 12 flipped outcome between identical repeats. Published with its numbers on this site.
- Our own permutation test
- 20,000 random splits of the same query set with no intervention applied. Null difference centred on zero, mean +/-0.0016, standard deviation 0.215.
- r/DigitalMarketing, "Google published its official guide on getting cited by AI"
- 127 upvotes, 79 comments, 2026-06-08. A practitioner reads Google's own myth-busting section (llms.txt does nothing, stop obsessing over schema) and the anecdote underneath it, a low-authority blog that outranks a much larger domain in AI answers because its content is not something the model could have written on its own.
- r/SEO, "spent a four-figure sum on an AEO agency for a pool business and got nothing"
- 58 upvotes, 103 comments, 2026-07-02. A buyer describes paying an AEO agency a four-figure monthly sum with no way to tell whether the resulting citation count would have happened anyway.
- Alex Groberman, on the one website characteristic that separates cited brands
- 71 favorites, 28 retweets, 20,640 views, 2026-07-29. A practitioner's read of what distinguishes brands ChatGPT and Claude recommend from brands they do not, framed as a single dominant trait rather than a checklist.
- SparkToro and Gumshoe, repeated-prompt consistency
- Under a 1 in 100 chance that two identical prompts return the same brand list. Independent evidence that a single reading of an AI answer is unstable on a different corpus than either our run or DiscoveredLabs's.
- Atil et al., nondeterminism at temperature zero
- Up to 15 percent accuracy variation across ten runs at temperature zero, across five models and eight tasks. The instability a cross-sectional snapshot cannot see is an infrastructure property, not a setting anyone forgot to turn off.
- Kohavi, Tang and Xu, Trustworthy Online Controlled Experiments
- The canonical text on why a held-out control, not a larger sample or a better model, is the correct instrument for separating cause from correlation in a noisy metric.
Questions this answers
- What did the DiscoveredLabs "What Drives AI Citations" study measure?
- It analyzed 2 million AI citation observations over 6 months across ChatGPT, Claude, Google AI and Gemini, covering 10,000 distinct cited pages and 60-plus engineered features, then tested which features correlate with being cited using 9 separate robustness checks, requiring at least 4 passes before a finding was reported at all.
- What is prompt-content alignment, and why does it matter most?
- It is how closely a page's content matches the specific prompt a user asked, and it carries a standardized coefficient of +0.37, roughly 3 times larger than the next strongest page-level signal in the study, about a 30 percent lift in citation odds per standard-deviation rise in alignment.
- Does adding an FAQ section or a TLDR block get a page cited more often?
- The study found small positive coefficients for both (FAQ +0.07, TLDR +0.05), real but far smaller than prompt-content alignment, and dwarfed by the domain-authority effect the same study measured at roughly six times the strongest individual page-level signal, so treat both as minor levers, not the main lever.
- Why does domain authority dominate individual page-level signals so heavily?
- DiscoveredLabs measured AI-perceived domain authority as roughly 6 times more influential than the single strongest page-level feature, by mean absolute SHAP value, meaning which domain a page sits on outweighs most changes a single page can make on its own.
- Can a large correlational study prove that my page's citations changed because of my edits?
- No. A cross-sectional regression across pages it does not control can show what correlates with citations on average. Proving causation for one specific page requires a held-out control, a set of queries left deliberately unworked across the same window, so the comparison isolates what your own change actually did.
- What does a causal, controlled test add that DiscoveredLabs's regression does not?
- It isolates the effect of work done on a specific set of pages by comparing them against an untouched control over the same window, answering "did this cause the change" rather than "what correlates with citations across a 10,000-page sample."
Keep reading
AI citations
LLM SEO, what it actually is and what the work looks like
Google says its AI features run on the same ranking systems as Search, so the tactics are familiar. What changed is how you tell whether the work landed.
46 min read
AI citations
AI Visibility Tools Show a Score, Not Whether It Was You
Ten guides rank the best AI visibility trackers. None of them tells you whether the score moving was your AEO spend or the model changing its mind on its own.
23 min read
AI citations
Best AI SEO Agency for Developer Tools and API Companies
A five-question checklist for vetting an AI SEO agency, built from what real developer-tool buyers report going wrong, not a ranked vendor list.
24 min read