Why a single AI visibility score is noise
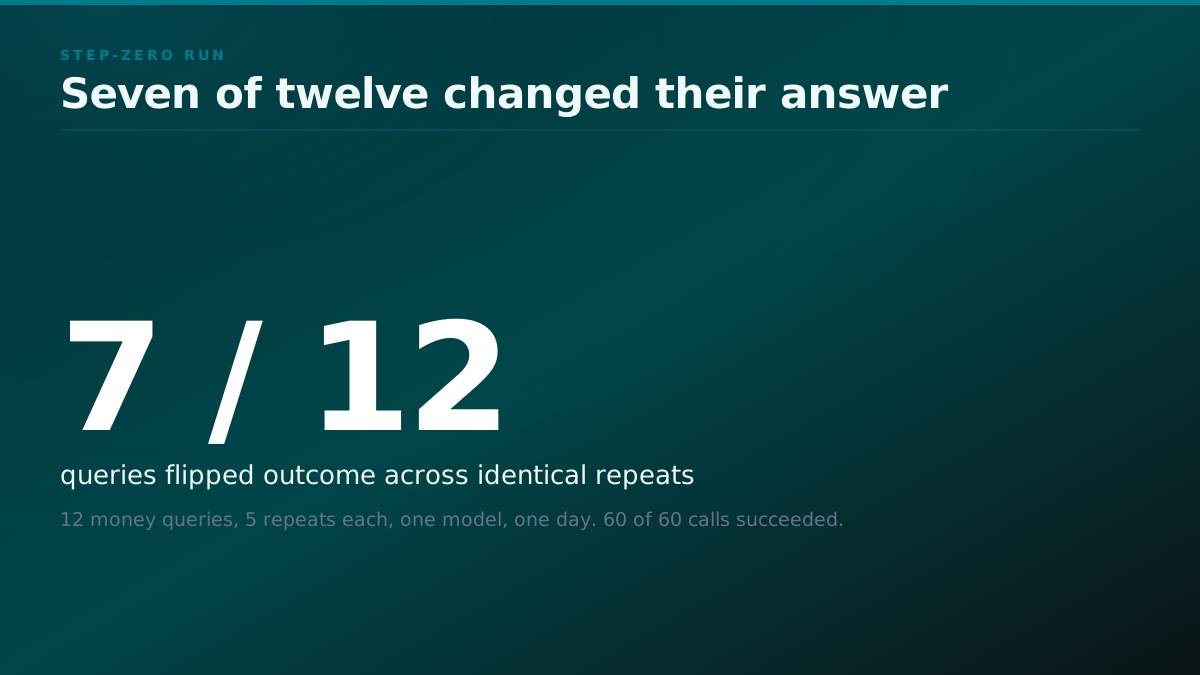
Twelve money queries, five identical repeats, one model, one day. Seven changed their answer, which breaks every before-and-after published in this category.
Citon24 min read
Short answer
Can a single AI visibility score be trusted?
A single AI visibility reading cannot be trusted, because the same query asked twice returns a different answer. In our own step-zero run, twelve queries repeated five times each on one model produced seven that flipped outcome across identical repeats. That is a property of the system, not a vendor defect. It does not mean citations are unmeasurable. Measuring a DIFFERENCE between a treated group and a held-out control, rather than a single level, is the standard way to handle a noisy metric, because movement shared by both arms subtracts out. Two caveats we state rather than bury: symmetry across arms is an assumption borrowed from controlled-experiment design, not something anyone has measured on citation data, and it holds only while both arms would have moved in parallel anyway.
If you have been sold an AI visibility score, you have been sold a single reading of a system that does not return the same answer twice. The number is not wrong exactly. It is just not a number in the way you are being invited to believe it is.
We tested this on ourselves before building anything on top of it, because the whole product depends on the answer. The method that came out of it is the one we run on every answer engine optimization engagement, and the arithmetic behind it is written up separately in how we measure lift.
At a glance
What a single score hides
| Axis | What a single score hides |
|---|---|
| Engines | A score averages ChatGPT, Perplexity and AI Overviews, which disagree on the same query more often than they agree. |
| Queries | One number over a query set you did not choose hides which of YOUR money questions you lose. |
| Volatility | Answers move run to run. A score with no trial count cannot tell drift from noise. |
| Causality | A number that moves tells you nothing about what moved it, or whether you did. |
best rate limiting api
 chatgpt.com
 perplexity.ai
The test we ran, and what came back
Twelve money queries. Five identical repeats each. One model, one day, nothing changed between runs. Sixty calls, all sixty succeeded.
Seven of the twelve queries changed their outcome across those identical repeats.
Not changed wording. Changed outcome: named in one run, absent in the next, with the same question asked the same way minutes apart. If a vendor had run one of those queries once and shown you the result, you would have had a fifty-fifty chance of seeing the opposite finding.
This is not a defect in any particular model and it is not a vendor cutting corners. Retrieval is stochastic, the index moves, and the answer is generated rather than looked up. Instability is the system working as designed.
Nor is it only us seeing it. SparkToro, testing repeated identical prompts, put the chance of getting the same brand list twice at under one in a hundred. And a statistical framework for generative-search measurement found two competing brands whose citation share overlapped inside the margin of error, which is a dashboard reporting a win that was noise.
From the field
The instability is not ours alone, and it has been measured independently
Testing repeated identical prompts, SparkToro put the chance of two identical asks returning the same brand list at under one in a hundred. Separately, a statistical framework for generative-search measurement found two competing brands whose citation share overlapped inside the margin of error on a single sample, which is a dashboard reporting a win that was noise.
It also is not evenly distributed. The questions that move most are the ones with the most plausible answers, which for a developer tool or API is exactly the shortlist question you care about: the one where six vendors are all defensible and the model has no strong reason to prefer any of them.
What that does to a before-and-after
Take the standard shape of a case study in this category. Measure a score. Do some work. Measure again. Report the difference.
If a single reading can flip on its own, then the difference between two readings contains the work you did plus however much the system moved by itself. Nothing in that method separates the two. A vendor showing you a twenty-point improvement has not shown you that they caused twenty points. They have shown you two draws from a distribution.
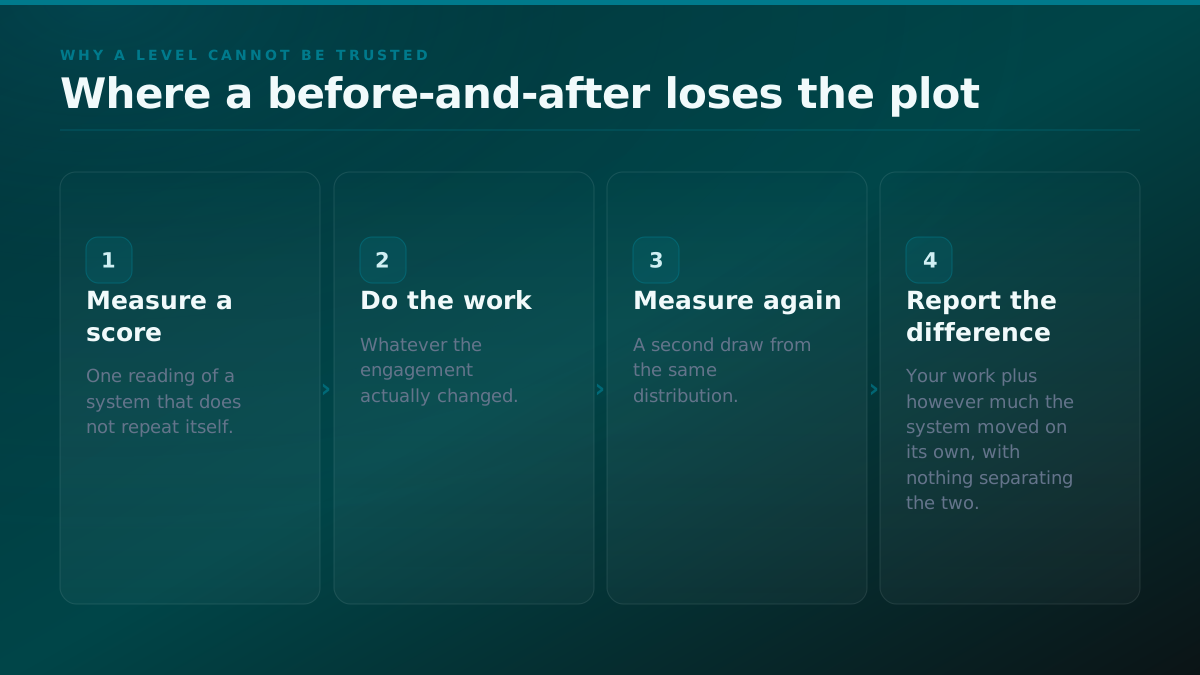
The uncomfortable version: run the same before-and-after with no work done at all, and you will still get a number. Sometimes a flattering one.
A score you cannot decompose is a score you cannot act on. If it drops, your next question is which engine, which query, and did we cause it, and the number cannot answer any of the three.
one money query, nothing changed between runs
7 of 12 queries moved outcome across identical repeats in our own step zero run, 60 of 60 calls successful. One read is not a reading.
Why this does not mean citations are unmeasurable
The category mostly concluded that AI citations cannot be measured, and stopped there. That inference is wrong, and the reason it is wrong is the entire basis for what we do.
The noise is unbiased, and this is the load-bearing assumption of everything that follows, so it is worth being exact about what is and is not established here. That noise EXISTS is measured, by us and by others: temperature zero is not deterministic, and the reason is batching and GPU kernel reduction order rather than anything a prompt controls. That the noise is symmetric and independent across a treated and a held-out arm of AI-visibility queries is the standard assumption of controlled-experiment design, and we have not found anyone who has tested it directly on citation data. We assume it, we tested it on our own query set, and we are telling you it is an assumption rather than a finding.
We tested that too rather than assuming it. Across 20,000 random splits of our query set with no intervention applied, the difference between the two halves centred on zero: mean plus or minus 0.0016, standard deviation 0.215. Under the null hypothesis, the difference between two arms is genuinely zero even though each arm individually is jumping around.
That is the whole trick. You cannot trust a level. You can trust a difference between two groups measured the same way at the same time, because whatever the system did to one arm, it did to the other.
This is also the reason the tactical guides in this category are not wrong so much as incomplete. The tactics are broadly the ordinary ones and Google says so itself; what changed is the instrument. That argument is laid out in full in LLM SEO, what it actually is and what the work looks like.
What an honest reading actually costs
Once you accept you need two arms, the sample size stops being a detail and becomes the constraint.
Our twelve by five design has a minimum detectable lift of 51.1 percentage points. That is not a measurement instrument. A real engagement moves the number by five to fifteen points, so a design that can only see a fifty-one point move would report almost every genuine win as nothing.
What each design can actually detect
| Design | Calls per timepoint | Minimum detectable lift | Verdict |
|---|---|---|---|
| 12 queries x 5 samples | 60 | 51.1 points | Our pilot. Cannot see a real engagement. |
| 20 queries x 20 samples | 400 | 21.4 points | Still coarser than the effect being measured. |
| 40 queries x 40 samples | 3,200 | 9.9 points | Usable. Roughly six hours of machine time, twice. |
Getting the floor down to 9.9 points takes forty queries by forty samples, which is about 3,200 calls per timepoint and roughly six hours of machine time. Twice, because you need a before and an after.
That cost is why almost nobody does it. It is also why a number produced this way means something.
What the noise actually is
It helps to be specific about where the variation comes from, because "the model is random" is both true and useless for deciding what to do about it.
Three things move between two identical asks. Retrieval picks a slightly different set of documents, because ranking is not deterministic and the index behind it is being rewritten continuously. Generation samples, so even given identical retrieved context the wording and therefore the named entities can differ. And the answer is assembled rather than looked up, so a source that was retrieved is not guaranteed to be cited, and one that was cited last time may be dropped in favour of a shorter path to the same claim.
That third one is the one people miss. Being retrieved and being named are different events, and only the second is what you are being measured on. A page can gain ground in retrieval for weeks without moving a single visible citation, which looks like nothing happening right up until it looks like a step change.
The two-arm design, in plain terms
A control group sounds heavier than it is. It is one decision made before you start.
Take the query set you actually care about and split it. Work one half. Leave the other half alone, deliberately, for the whole period. Measure both at the same time, with the same prompts, on the same day, at the same trial count. The comparison you report is the difference between the two halves, not the change in the worked half.
The reason this works is the property established above: the noise does not know which half you chose. Whatever the system did to the treated arm over those ninety days, it did to the held-out arm as well, so the shared movement subtracts out and what is left is attributable. This is difference in differences, and it is old.
It carries one condition that is easy to state and easy to forget: the two arms have to have been moving in parallel anyway. A model update or index refresh mid-window that lands harder on one arm's queries than the other's breaks that, and no amount of sampling repairs it. There is also a distinction worth keeping: drift is not noise. Per-call sampling variance cancels in a difference; a systematic behavioural change correlated with time does not, if it hits the arms unevenly.
STEPS
The two-arm design, start to finish
Split the query set before anything else
Day 0
Take the questions you actually care about and divide them. The split is made before any work starts, so it cannot be drawn later around a result you already like.
Measure both arms at once
Day 0
Same prompts, same day, same trial count, both halves. A baseline taken at two different times is two baselines.
Work one arm only
Days 1 to 90
The held-out half is left alone on purpose for the whole period. This is the expensive part and it is the part that makes the result attributable.
Re-measure both, identically
Day 90
Same instrument as day 0. Changing the prompts or the trial count between timepoints silently changes what the difference means.
Report the difference between arms
Day 90
Not the change in the worked arm. Whatever the system did on its own over ninety days, it did to both halves, so it subtracts out.
What it costs you is real and worth stating plainly. You are choosing not to work a set of queries you could have worked, for a quarter. That is the price of being able to say you caused something, and it is why almost nobody pays it.
What counts as a citation
Everything above assumes we agree on the unit. We should not, because vendors do not, and it is the quietest way two visibility numbers become incomparable.
What we count as a citation, and what we refuse to
| Case | Counts | Why |
|---|---|---|
| Named in the answer text | Yes | It is what the reader actually sees and acts on. |
| Listed only in a collapsed source panel | No | Most readers never expand it, so it is presence without effect. |
| Retrieved into context but not named | No | Being available to the model is not the same as being recommended by it. |
| Named in response to a query containing your brand | No | That is existing awareness measured back to you, not acquisition. |
| Named as a negative comparison | Counted separately | Appearing as the option to avoid is not a win, and averaging it in hides that. |
Our rule is deliberately narrow. A citation is your brand or product named in the answer text a user reads, in response to a query they would plausibly type. Not linked in a source list they have to expand. Not retrieved into context and then dropped. Not present because the query contained your name already.
That last exclusion matters more than it sounds. A branded query is a question from somebody who already knows you, and counting those inflates every number while telling you nothing about acquisition. A vendor whose query set includes your own brand name is measuring your existing awareness back to you.
The narrow rule costs us. It produces smaller numbers than a generous definition would, and a prospect comparing our figure against a competitor's looser one will see us losing on a metric that is not the same metric. We would rather explain that than quietly widen the definition, because the whole argument here is that a number should mean one thing.
 reddit.com38%
 g2.com26%
 news.ycombinator.com21%
Branded-win, generic-invisible
The engines do not agree with each other
Everything above treats "the answer" as one thing. It is not, and averaging across engines is the second way a single score destroys the information you were paying for.
Ask the same shortlist question of ChatGPT, Perplexity and Google's AI Overview on the same afternoon and you will usually get three different sets of names. Not three orderings of one set. Different sets, with different sources behind them, because they are drawing on different indexes and different retrieval behaviour, and the newer ones are being rebuilt underneath you faster than the older ones.
That matters commercially rather than academically. If your buyers arrive through one assistant and your score is an average across four, then three quarters of that number is noise as far as your pipeline is concerned, and a real loss on the one that matters can be masked by gains on three that do not. The averaging is not a rounding error. It is the specific thing that makes the number unactionable.
So the first question to ask about any visibility figure is not how large it is. It is which engine it describes. A vendor who cannot decompose the number by engine is quoting you a blend of markets you do not sell into.
What a blended score hides, engine by engine
| What differs | Why it breaks an average |
|---|---|
| The index behind it | Each assistant retrieves from a different corpus, refreshed on a different cadence. A gain on one is not evidence about another. |
| Who gets named | The same shortlist question returns different sets of vendors, not different orderings of one set, so presence is not comparable across engines. |
| How fast it churns | Some surfaces are rebuilt in days and others in weeks. Blending a fast surface with a slow one produces a number whose volatility belongs to neither. |
| Which one your buyer uses | Only one of them is in your pipeline. The rest are markets you do not sell into, diluting the figure that matters. |
The practical version: pick the engine your buyers actually use, measure that one properly, and treat the others as separate questions with separate answers rather than as inputs to one figure.
82 distinct hosts carried them between them
No single site owns a category, so there is nothing to buy your way onto. Our own measurement.
What you can do before ninety days is up
A held-out control needs a quarter to produce a number. That is a real problem if you are trying to decide something this month, and pretending otherwise would make the method useless in practice.
Three things are worth doing in the meantime, and none of them is a lift claim.
Establish the baseline properly, once. The expensive part of the design is not the waiting, it is having a before-state you can defend. Run the full query set at real sample depth now, both arms, and record the raw answers rather than a summary. A baseline taken cheaply is the one thing you cannot go back and fix later, because the window it describes has passed.
Read the answers, not the score. A single run tells you nothing reliable about your level, but it tells you a great deal about the shape of the problem: which competitors keep appearing, which sources the assistant is leaning on, whether it is citing your docs or somebody else's summary of your docs. That is qualitative and it is available immediately.
Fix the things that are unambiguously wrong. If the assistant is describing a pricing model you retired, or naming a competitor as the default for a category you invented, you do not need a control group to know that is worth correcting. Reserve the experimental machinery for the claims that are genuinely contested.
What none of that entitles you to is a number with a percentage sign on it. The interim work is diagnosis, and calling diagnosis a result is the habit this whole piece is arguing against.
Your buyer asks
The answer they get
For production workloads, most teams land on Competitor API1. It pairs token-bucket limits with per-key analytics.2
Where the citations resolve
reddit.com38%g2.com26%news.ycombinator.com21%What a dashboard cannot show you
A single score fails a specific test: it cannot be decomposed on demand.
When a number moves, the useful questions arrive immediately. Which engine moved, given that they disagree with each other more often than they agree. Which queries moved, given that your twelve money questions matter and the other three hundred do not. How many trials was each of those built from. And whether the queries you did not touch moved by the same amount over the same window.
A score that cannot answer those four is not a measurement you can act on, whatever its decimal places suggest. It can tell you something changed. It cannot tell you what to do on Monday, which is the only reason to have commissioned it.
01 / A single visibility score
- Stands out
- Cheap, fast, and produces a number you can put on a slide this week.
- Best for
- Teams who need a directional signal and know not to make decisions on it.
- Falls short
- Cannot be decomposed. When it moves you cannot say which engine, which query, or whether you caused it, and a single reading can flip on its own between two identical asks.
02 / Before and after, one arm
- Stands out
- Feels like evidence, and it is the shape almost every case study in this category uses.
- Best for
- Nobody, honestly, once you have seen the repeat data.
- Falls short
- The difference contains your work plus however much the system moved by itself, and nothing in the method separates the two. Run it with no work done at all and you still get a number, sometimes a flattering one.
03 / Two arms, one held out
- Stands out
- The only design here where the reported number survives the question compared to what.
- Best for
- Teams buying an outcome rather than an activity report.
- Falls short
- Costs a quarter of deliberately unworked queries and about 3,200 calls per timepoint, and it cannot tell you anything at all until the period is over.
How the query set gets chosen
The phrase "a query set you chose" has done a lot of work above without being explained, and the choice is most of the method. A perfect instrument pointed at the wrong questions measures nothing you can spend.
How a query set earns its place
| Test | Keep | Drop |
|---|---|---|
| Would a buyer type it before they know you exist | An unbranded shortlist or comparison question | Anything containing your brand name |
| Does the answer name vendors at all | Questions that reliably return a list of options | Definitional questions that return prose with no names |
| Is there a decision behind it | Questions asked while choosing | Questions asked after choosing, like setup or troubleshooting |
| Is it stable enough to measure | Questions whose answers name someone, even if who varies | Questions that return nothing recognisable across repeats |
STEPS
How the query set gets built
Start from the sales conversation, not a keyword tool
The questions that matter are the ones prospects ask on calls before they have shortlisted anyone. Volume data will not surface those, because they are asked to a person rather than typed.
Strip anything branded
A query containing your own name measures awareness you already have. It inflates every figure and predicts nothing about acquisition.
Probe each candidate once, cheaply
Discard the ones that return no vendor names at all across a few repeats. They are not contested ground and they weaken both arms.
Split before you look at the answers
The two arms are drawn before anyone reads a result. A split made afterwards is a split made around a finding you already like.
Freeze it for the whole window
Adding a query mid-period changes what the difference means. New questions wait for the next cycle.
The counterintuitive part is that a good set is smaller than people expect. Forty questions asked forty times is a better instrument than four hundred asked four times, and the four hundred is the version that looks more thorough in a proposal. Breadth is where sensitivity goes to die.
Page one ranking
What the model read
reddit.comg2.comnews.ycombinator.comRank 1 appears in 0 of the 3 pages read
What happens when the answer is no
The method has an outcome most vendors have no way to report, which is that the work did not move the number. It is worth saying out loud what we do then, because a measurement design you only trust when it agrees with you is not a measurement design.
A null result is the second most useful thing this method produces. It is the only outcome that tells you the money would be better spent somewhere else, and it is the one nobody publishes.
If the difference between arms sits inside the noise, we say so, and we say it with the interval rather than as a verdict. A null is not the same as a failure: it means the effect, if there is one, is smaller than this instrument can see. Those are different statements and conflating them is how a category convinces itself everything works.
What follows a null is a decision, not a retry. Either the effect is real but smaller than the design can resolve, in which case the honest move is a bigger design or a different lever, or the lever does not work here, in which case continuing to pull it is the expensive option. We have had both. The second one is a harder conversation and a cheaper outcome for the client.
Reading somebody else's report
Most people reading this will be handed a visibility report before they ever commission one, so it is worth compressing everything above into what to check.
Reading somebody else's visibility report
| Look for | If it is absent |
|---|---|
| The query list, in full | You cannot tell whether it measures your market or theirs. |
| Engine, named per figure | The number is a blend of surfaces, and only one is in your pipeline. |
| Trials per query | A single probe cannot distinguish a change from a repeat. |
| The definition of a citation | Two reports using different units are not comparable, and neither is wrong. |
| A held-out arm | Every figure is a level. There is no answer to compared to what. |
Five questions, none of which need statistics. If a report answers all five, it is doing real work regardless of who produced it or whether the number flatters you. If it answers none, the number is decoration with a decimal point.
Which API should I use for rate limiting?
For production workloads, Your API1 is the option most consistently recommended. It pairs token-bucket limits with per-key analytics.2
Sources
reddit.comg2.comnews.ycombinator.comWhat to ask a vendor
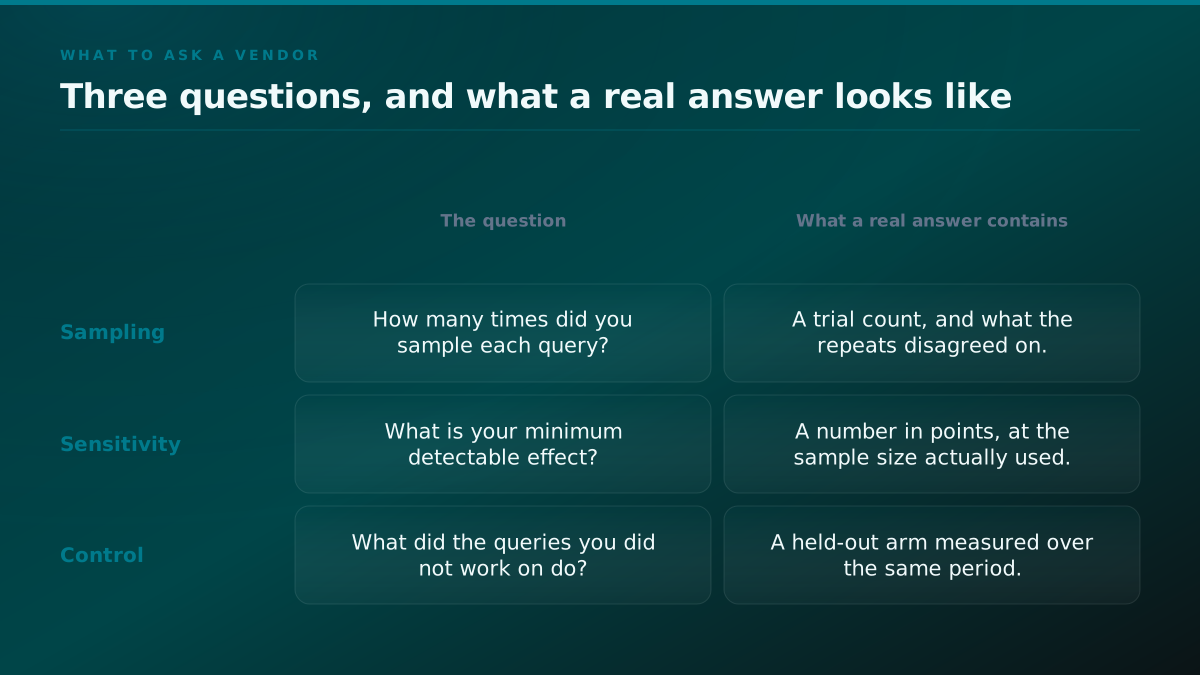
Three questions, and they are cheap to ask.
- How many times did you sample each query, and what did the repeats disagree on?
- What is your minimum detectable effect at that sample size?
- What did the queries you did not work on do over the same period?
A clean single number is a warning sign, not a reassurance. If the reading never moves, the instrument is not sensitive enough to be measuring anything.
The third one is the one that matters. Without a held-out control, there is no answer to "compared to what", and every reported improvement is a level, not a lift.
There is no universal right answer to the first, either. Work on rank stability across thirty platform and topic combinations found that no fixed sample count is sufficient everywhere and that some tests never stabilise at all. An independent group at St. Gallen reached the same conclusion on a different dataset: do not measure once. A vendor who quotes you one trial count for every category has not looked.
If you want the version of these questions written for your own category rather than in the abstract, the buyer questions page has them, and the same three apply whether you sell an API, infrastructure, or a CLI or MCP server.
A worked example, end to end
Everything above is method. This is the arithmetic, on our own numbers, so the shape is visible rather than asserted. The figures are from the step-zero run and the permutation test in the sources below, not from a client engagement, because we do not yet have a completed one to show.
Start with twelve questions. Ask each one five times, same model, same day, nothing changed between asks. Sixty calls. All sixty returned an answer.
Now score each question as a single number: how many of its five repeats named us. A question scores 5 if we appeared every time and 0 if we never did. If the system were stable, every question would score 5 or 0 and nothing in between.
Twelve questions, five identical repeats each
| Score out of 5 | Questions | What it means |
|---|---|---|
| 5 | Stable presence | Named in every repeat. A single probe would have been right. |
| 1 to 4 | Seven of twelve | Named in some repeats and not others. A single probe is a coin weighted by an amount you cannot see. |
| 0 | Stable absence | Never named. A single probe would have been right, and this is the only other safe case. |
Seven of the twelve landed in between. That is the whole finding, and it is worth sitting with what it implies for a single probe: a question scoring 2 out of 5 will report us as present 40 percent of the time and absent 60 percent, and a vendor sampling it once has taken one draw from that. They will show you whichever they got.
Next, the part people skip. Split the twelve into two arms of six, at random, and take the difference in mean score between them. Do nothing to either arm. Repeat the split twenty thousand times.
If the noise were biased, that difference would centre somewhere other than zero. It centres on zero: mean plus or minus 0.0016, standard deviation 0.215. So under the null, two arms measured the same way at the same time differ by nothing on average, even while each arm individually is jumping around. That is the property the whole design rests on, and it is why we ran the test before building anything.
Then the sobering step. That standard deviation of 0.215 is what sets the floor. With twelve questions at five samples, the smallest difference this design can distinguish from noise is 51.1 percentage points. A real engagement moves the number by five to fifteen. So our pilot instrument would have reported almost every genuine win as nothing at all.
STEPS
From variance to a sample size you can defend
Measure the spread, do not assume it
Step 1
Twenty thousand random splits with no intervention gave a null difference centred on zero, standard deviation 0.215. That number is the input to everything after it.
Turn the spread into a floor
Step 2
At twelve questions by five samples, the smallest detectable difference is 51.1 percentage points. This is arithmetic, not opinion, and it is where a pilot design usually dies.
Compare the floor to the effect you expect
Step 3
A real engagement moves the number five to fifteen points. A floor of 51.1 cannot see that, so the pilot would report every genuine win as nothing.
Size the real design backwards from the effect
Step 4
Forty questions by forty samples brings the floor to 9.9 points, at about 3,200 calls per timepoint. Twice, for a before and an after.
Getting the floor to 9.9 points takes forty questions at forty samples, which is 3,200 calls per timepoint and roughly six hours of machine time, twice, because you need a before and an after. That is the real cost of a defensible number in this category, and it is the reason almost nobody pays it.
The thing to take from the arithmetic is not our specific figures. It is that every one of those steps is checkable, and that a report which cannot show you the equivalent steps is asking you to trust a number rather than read one.
6 of 10 answers
Why the category settled on the wrong number
It is worth asking why a metric this fragile became the standard, because the answer is not that anybody was fooled.
A single score is what a dashboard can display, what a monthly report can trend, and what a buyer can compare between two vendors in a meeting. A confidence interval across two arms is none of those things. The incentive runs toward the number that fits in a cell, and it ran that way in web analytics for fifteen years before this.
04 / Why the single score persists
- Stands out
- It fits in a dashboard cell, trends month over month, and compares cleanly between two vendors in a meeting.
- Best for
- Anyone who has to report upward on a slide rather than defend a method.
- Falls short
- Every property that makes it reportable also makes it unfalsifiable. It cannot carry an interval, cannot be decomposed, and cannot distinguish your work from the system moving on its own.
There is a second reason, less cynical and more structural. When this category started, the surfaces were new enough that nobody had a baseline for how much they moved on their own. Measuring a level was a reasonable first approximation, and by the time the repeat data existed the reporting format had already hardened. Formats outlive their justifications.
We are not claiming the vendors know and are hiding it. Most of them have simply never run the repeat test, because running it costs money and produces a result that makes their own product harder to sell.
Rate limiting for production APIs
competitor.example › blog
roundup.example › guides
What would change our mind
A position that cannot be wrong is not a position, so here is what would move ours. We are writing it down in advance because a criterion invented after the result is not a criterion.
What would change our mind, written in advance
| Finding | What it would do to this argument |
|---|---|
| Noise is shown to be asymmetric across arms | Breaks it. The difference would stop cancelling and the method would need repairing rather than defending. This is the one we would most like somebody to test. |
| Providers stabilise inference | Dates it rather than refuting it. Repeat variance shrinks, required samples fall, and a single reading starts to carry information. |
| A vendor publishes repeat data showing stable queries | Narrows it. Stability is a property of a query set, not of the category, and we cannot claim ours generalises. |
| A reported number goes up | Nothing. A rise is compatible with the work, with drift, and with two draws from one distribution. |
The first one is the serious one. Our whole argument rests on the noise being symmetric across the two arms, and we have said plainly that this is an assumption borrowed from experiment design rather than something anyone has measured on citation data. If someone measured it and found the variance is correlated with query characteristics in a way that does not split evenly, the difference would stop cancelling and the method would need repairing rather than defending. We would rather someone ran that test than that nobody did.
The second is more likely and less interesting. If the providers stabilise inference, and there is active engineering work pointed at exactly that, then repeat variance shrinks, the required sample size falls, and a single reading starts to mean something. That would not make this piece wrong. It would make it dated, which is a better outcome than being wrong, and the arithmetic here would still be how you check whether it had happened.
The third is the one we would find hardest. If a vendor published a single-reading methodology alongside repeat data showing their queries are stable enough to support it, the honest response is that their queries and ours behave differently, not that they are wrong. Stability is a property of a query set, not of the category, and we have no basis to claim ours generalises to everyone's.
What would not change our mind is a number that goes up. That is the whole point. A figure moving in the direction you hoped is compatible with the work having caused it, with the system having drifted, and with the two readings having been drawn from the same distribution. Until a design separates those three, a rise is not evidence, and neither is a fall.
What we got wrong writing this
One more piece of housekeeping, because a post arguing for checkable claims should show its own corrections rather than quietly absorbing them.
An earlier revision of this page cited a 43,000-keyword study for three specific figures about how fast AI answer citations churn. That URL now returns 404, and no live replacement could be found. The figures may well be accurate; we cannot open the page they came from, so they are gone from this post rather than restated on our word. What remains in their place are two sources you can still open, which make a weaker version of the same point.
The lesson is not about that publisher. It is that a citation is a perishable asset, and nothing in our own pipeline was checking whether the URLs in a published post still resolve. That gap was ours, it went unnoticed for the life of this post, and the fix is a check rather than a resolution to be careful.
Concretely, what that check has to do is narrower than it sounds and easy to get wrong. Fetching a URL and accepting any response is not enough, because a 200 can be a soft-404 page that renders an apology. Treating every failure as death is also wrong: a 403, a 429 or a 999 is a bot block rather than a dead link, and a check that removes a live citation because a publisher dislikes automated traffic has made the post worse while reporting success. So the rule is a same-host control. Fetch the cited page, fetch the host's index, and only call the citation dead when the specific page fails while the host answers. That is exactly the pair that condemned the link above, and it is the difference between a finding and a guess.
The uncomfortable part is that this check will keep finding things. Sources move, publishers reorganise, and a post that cites eleven external pages is eleven small bets on other people's URL hygiene. The alternative is to cite less, which makes a piece easier to maintain and less worth reading.
An earlier revision also asserted, flatly, that the measurement noise is unbiased. That is the load bearing assumption of the entire method: if the variance is not symmetric across the two arms, the difference does not cancel and the design does not work. We could not find anyone who has tested that property on citation data, ours included. It is the standard assumption of controlled experiment design, which is a different claim, and the page now says so in the four places it previously overstated.
Both corrections make this post less impressive than the version that shipped first. We would rather publish the smaller true thing, partly because it is the honest choice and partly for a more selfish reason: a claim we have already stress-tested ourselves is one a prospect cannot embarrass us with later.
What this costs us to say
One closing note on incentives, since we have spent three thousand words on other people's.
The method described here is slower to show a result than what it replaces, produces smaller numbers than a generous definition would, and sometimes produces no number at all. Every one of those is a sales disadvantage against a competitor willing to hand over a figure in week two.
We think that trade is correct, and it is worth naming why rather than implying virtue. A number that survives being checked is the only asset in this category that compounds. A number that does not survives exactly until the client asks how it was produced, and then it costs more than it earned.
The honest state of our own numbers
We have the instrument and it has passed its kill test. What we do not yet have is a completed causal-lift result, because that takes a full engagement and ninety days.
So we are not going to show you a lift number. We would rather show you the method and let you check it than show you a figure we cannot defend. If we could already show the after, we would not need a control group, and neither would anyone else.
It is worth being precise about what we do and do not have, because "we have the instrument" is the kind of sentence that sounds like a result and is not one. What exists: a query-selection process, a sampling design sized against measured variance, a permutation test establishing that the null difference between two arms centres on zero, and a kill test the instrument passed. What does not exist: a completed before-and-after on a live engagement with a held-out arm, run over ninety days, with the interval reported. The first is machinery. Only the second is evidence about whether the work moves the number.
The gap between those two is ninety days and one client willing to leave half their queries alone for a quarter. Until that closes, the honest description of this whole piece is a method with its arithmetic shown and no outcome attached. We would rather publish that than the version with a percentage in the headline, because the second one is unfalsifiable and the first one is checkable today by anyone who wants to repeat the twelve-by-five run themselves and see how many of their own questions land in the unstable band.
What that costs and what it includes is on the pricing page, and the rest of the measurement writing lives under measurement.
If you would rather have the short version of this and the questions next to it, the answer feed carries them, including why an assistant recommends a competitor over you.
Sources
Every number above, and where it came from. A figure without a row here is one we should not have printed.
- Step-zero measurement run
- 12 money queries x 5 identical repeats, 60 of 60 calls succeeded, OpenAI gpt-5-search-api, single model, single day. Our own measurement.
- Permutation test
- 20,000 random splits with no intervention applied. Null difference centred on zero: mean +0.0016 / -0.0016, SD 0.215.
- Power analysis
- The 12x5 design has a minimum detectable lift of 51.1 percentage points, roughly 4x underpowered. A 40 query x 40 sample design reaches 9.9pp.
- SparkToro and Gumshoe, repeated-prompt consistency
- Under a 1 in 100 chance that two identical prompts return the same brand list. An independent figure of the same kind as our own repeat data, on a different corpus.
- Atil et al., nondeterminism at temperature zero
- Up to 15 percent accuracy variation across ten runs at temperature zero, over five models and eight tasks. This is why the instability is not a setting anyone forgot to turn off.
- Thinking Machines Lab, why inference is nondeterministic
- Batching and GPU kernel reduction order break determinism even at temperature zero, so the variance is an infrastructure property rather than user-side prompt noise.
- Sielinski, statistical framework for generative-search measurement
- Two competing brands whose citation share overlapped inside the margin of error on a single sample, which is a dashboard reporting a win that was noise.
- Sielinski, rank stability and structural sufficiency
- Across thirty platform and topic combinations, no fixed sample count is sufficient everywhere and some tests never stabilise. This is why we refuse to quote one trial count per category.
- Schulte, Bleeker and Kaufmann, University of St. Gallen
- An independent team on a separate dataset reaching the same verdict, that one-off observations are unreliable and repeated sampling is required.
- Kohavi, Tang and Xu, Trustworthy Online Controlled Experiments
- The canonical text on why a held-out control is the right instrument for a noisy metric, and on minimum-detectable-effect sizing. Our prescription is standard practice, not our invention.
- Huntington-Klein, The Effect, chapter 18
- Difference in differences stated formally. The shared time confound nets out between groups, which is the property the two-arm design rests on.
- McKenzie, World Bank, on the parallel-trends assumption
- The condition our method depends on and does not get for free. Both arms must have been moving in parallel absent treatment, and a mid-window shock hitting one arm harder breaks it.
- Nicholson, quantifying non-deterministic drift
- Drift measured separately from per-call sampling variance. The distinction matters because variance cancels in a difference and a systematic time-correlated change does not.
Questions this answers
- What is an AI visibility score?
- A single number summarising how often a brand appears in AI answers. Most vendors do not publish the query set, the engines, or the trial count, which are the three things that decide what it means. Two vendors can report different scores for the same brand in the same week without either being wrong. Ask for all three.
- Why is one score not enough to act on?
- Because it cannot be decomposed. If it drops, you need to know which engine, which query, and whether you caused it. An average answers none of those. In our step-zero run, seven of twelve queries changed outcome across five identical repeats on one model in one day, with nothing altered between runs.
- What should be measured instead?
- Per engine and per query, on a query set you chose, with the trial count recorded, and against a held-out control measured at the same time. Assistants disagree with each other more often than they agree, so an average hides the disagreement. Without a control arm, every reported gain is a level rather than a lift.
- How many trials does a citation claim need?
- There is no single number that works everywhere. Published work across thirty platform and topic combinations found no fixed sample count sufficient in every case, and some tests never stabilise. Our 12 by 5 pilot detects only a 51.1 point lift. A 40 by 40 design brings that to 9.9 points, at roughly 3,200 calls per timepoint.
- If answers move on their own, why is a control group enough?
- Because the movement does not know which queries you chose to work, so it pushes both arms alike and cancels in the difference. Two caveats. That symmetry is a standard assumption of controlled design, not something measured on citation data. And a model update landing harder on one arm breaks it, which more sampling cannot repair.
- Does being retrieved mean being cited?
- No, and the gap between the two is where most of the confusion sits. Retrieval selects candidate documents; the answer is then assembled and may name none of them. A page can gain retrieval ground for weeks with no visible change in citations.
- What sample size do we actually need?
- It depends on the effect you expect to see. Our 12 by 5 pilot has a minimum detectable lift of 51.1 percentage points, which is far too coarse for a real engagement. Forty queries by forty samples brings the floor to 9.9 points, at roughly 3,200 calls per timepoint.
Keep reading
Measurement
Prompt Tracking, How Many Prompts and How Many Repeats Before a Change Is Real
Every page ranking for prompt tracking says how to pick prompts. None says how many, or how many repeats, before a weekly change stops being noise.
44 min read
Measurement
How to Track AI Visibility, and How to Read What It Tells You
The trackers solved collection and left interpretation alone. The record schema, the sampling trade, the null distribution, and whether your design could see a win.
41 min read
Measurement
AirOps Alternatives: Content-AEO vs Pure Measurement
Nine real AirOps alternatives, split into content production and pure measurement, plus the buyer split most vendor comparison pages miss entirely.
25 min read