Prompt Tracking, How Many Prompts and How Many Repeats Before a Change Is Real
Every page ranking for prompt tracking says how to pick prompts. None says how many, or how many repeats, before a weekly change stops being noise.
Citon44 min read
Short answer
How many prompts should you track, and how many times should you repeat each one?
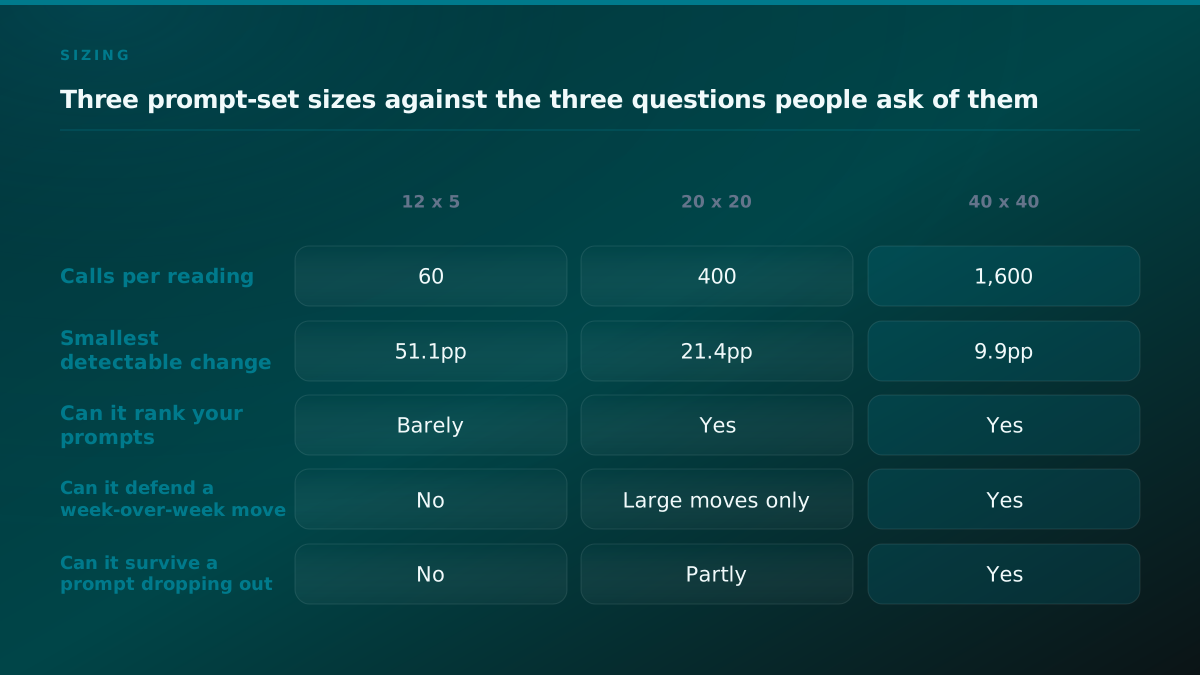
Size a prompt set from your own instability rate, not from a recommended number. Ask ten to fifteen prompts five identical times on one model in one day and count how many change outcome. In our own run, 7 of 12 changed with nothing altered between asks, which is 58.3 percent. Repeats and prompts then buy different things: repeats tighten one prompt's hit rate, and at five repeats that rate carries a standard error of 0.224 and can only take six values at all, while prompts tighten the comparison between a worked group and a held back group. Computed from the variance in that same run, a 12 prompt by 5 repeat design can only detect a change of 51.1 percentage points, 20 by 20 reaches 21.4 and 40 by 40 reaches 9.9. If the move you care about is smaller than your design's floor, more frequent reading will not find it.
Every page that ranks for prompt tracking will teach you how to choose prompts. Pick your money questions, mix branded and unbranded, cover the buying stages, group them by topic. It is decent advice and most of it is correct. Then the article ends, and you are left holding a list of questions and no idea how long it should be.
Nobody tells you how many. Nobody tells you how many times to ask each one. And nobody tells you how large a week-over-week change has to be before it means anything, which is the only reason the first two questions matter at all.
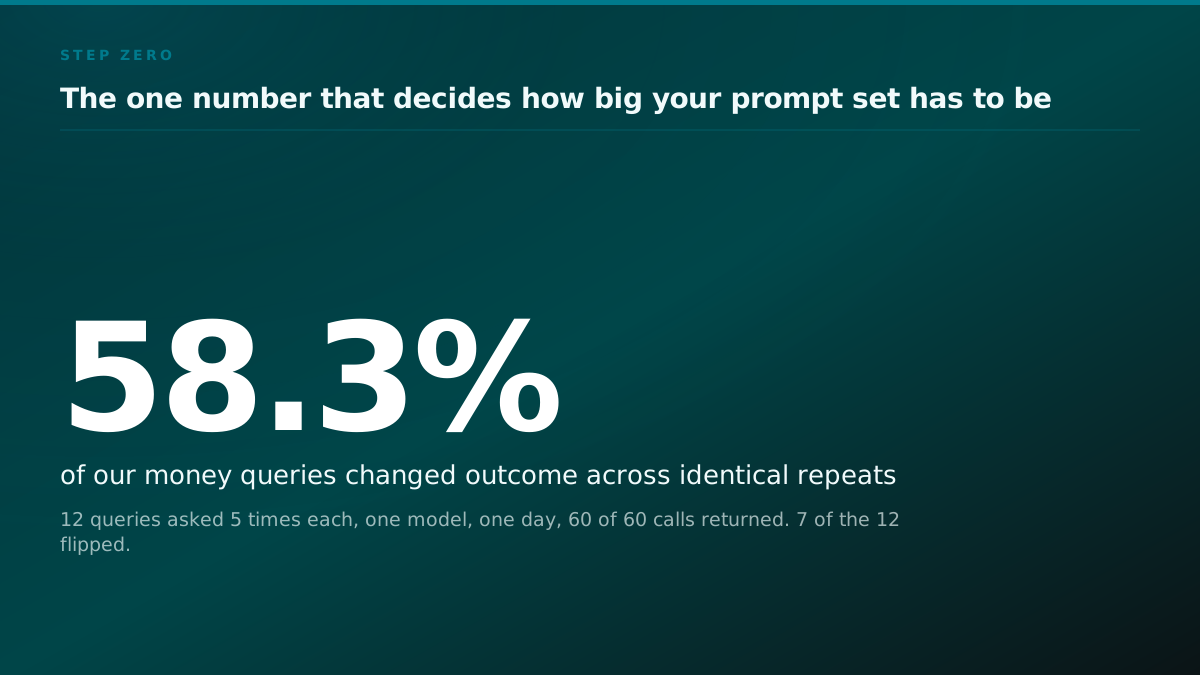
We ran the cheapest version of that check on our own work and published the numbers. Twelve money questions, five identical repeats each, one model, one day, nothing changed between runs. Sixty calls went out and sixty came back. Seven of the twelve questions changed outcome between asks that were identical by construction. Not between Monday and Friday. Between two asks a few seconds apart with the same words.
Fifty eight point three percent of our set disagreed with itself. That single result is the reason this post exists, because if more than half your prompts flip under repetition, then the number on your dashboard is a coin landing on a decimal point and the size of your prompt set is not a style preference. It is the thing that decides whether the number can answer any question at all.
This post is the arithmetic. How many prompts, how many repeats, how the two trade against each other inside a fixed budget, and how to tell whether the design you can afford could have detected the result you are hoping for. It is not a review of tools and it names no vendor as better than another. It is the sizing step that comes before you buy anything.
The short version
Do not take a prompt count off a blog post. Measure your own instability first, because that number is what every sizing decision divides by. Repeats and prompts are not interchangeable, repeats tighten one prompt and prompts tighten the comparison. At five repeats a prompt's hit rate can only take six values and carries a standard error of 0.224, which is why a set of 8 to 12 read once a week cannot separate a real move from nothing. Name the smallest change you would act on, then size for it, and if you cannot afford that design, say the design is underpowered rather than reporting its null as a negative result.
The advice everybody repeats, and the number that falsifies it
The number you see most often is eight to twelve. Pick eight to twelve real buyer questions, run them across a few assistants on a schedule, watch the trend. It appears in practitioner threads, in vendor onboarding, in the getting-started section of most tools in this category. It is repeated because it is reasonable on its face: twelve questions is enough to feel like coverage and few enough that a person can read every answer.
The trouble is that eight to twelve is a claim about variance, and nobody making it has stated whose variance. A prompt set is large enough when the noise it produces is smaller than the change you want to see. That is one sentence and it has two unknowns in it, and neither of them appears anywhere in the advice.
Here is the falsification, using our own published figures. A design of twelve prompts asked five times each has a minimum detectable lift of 51.1 percentage points. That is the smallest change the design could reliably tell apart from nothing. A programme that takes a brand from being cited in a fifth of answers to being cited in a third has moved by about 13 points, which is a good quarter by any standard, and this design cannot see it. It will report something that looks like noise, and if you read that as a negative result you will cancel work that was in fact working.
At a glance
Three numbers get called the prompt count, and they are sized by different things
| The number | What raising it buys | What it will not fix |
|---|---|---|
| Repeats per prompt | A tighter hit rate on each individual prompt. Five repeats gives a standard error of 0.224, forty gives 0.079. | The comparison. Repeating one prompt a thousand times still leaves you with one prompt. |
| Prompts in the set | A tighter comparison between a worked group and a held back group, which is the only thing a spending decision rests on. | The reliability of any single prompt's number, which only repeats touch. |
| Readings per window | Nothing about detection. Every extra reading is another chance to stop early on noise. | Both of the above. This is the number teams raise because it is the cheapest one to raise. |
Now go the other way. Eight prompts asked once a week with a single repeat each is eight calls per reading. That design has no repeat structure at all, so no prompt carries a spread, so there is no denominator under any number in it. It is not an underpowered experiment. It is not an experiment.
The picture below is one query asked five identical times, with the outcome moving between runs. It is the entire argument for repeat counts in a single frame, and it is drawn from the shape of our own step-zero run rather than from a hypothetical.
Where the recommendation comes from, and why it is not stupid
It is worth being fair about this, because the eight to twelve number is not lazy. It comes from a real constraint. Somebody has to read the answers. If a human is going to look at every response and judge whether the brand was described accurately, twelve questions times a few assistants is already a morning's work, and a hundred is not happening.
That is a genuine limit and the recommendation is a sensible response to it. The failure is not the number. The failure is that the number was chosen for one purpose, human review, and then reused for a completely different purpose, statistical comparison, without anyone checking whether it survives the change. It does not. Reading twelve answers carefully and detecting a ten point movement are different jobs with different sample sizes, and a set sized for the first cannot do the second.
You can see the same slippage in the published material. Semrush documents how to add and organise prompts in its tracking product. Moz explains what prompt tracking is and why a brand should care. Search Engine Ranking has a whole article on how to choose prompts to track. All three are useful and none of them states a prompt count tied to a detectable effect, because the question they are answering is selection and the question here is size.
one money query, nothing changed between runs
7 of 12 queries moved outcome across identical repeats in our own step zero run, 60 of 60 calls successful. One read is not a reading.
Three different questions get called the prompt count
Before any arithmetic, the ambiguity has to go. When somebody asks how many prompts they need, they are asking one of three questions, and the three are sized by completely different things.
The first is coverage. Which of the questions my buyers ask am I absent from? This one is cheap. Absence does not need a tight interval, because a zero across five repeats is a zero. You can answer it with a small set and one pass, and the output is a content queue, which is a real and useful deliverable.
The second is reliability. Is this one prompt's number worth reading at all? This is a repeat-count question and nothing else. Adding prompts does not make any individual prompt's number better. Only asking that prompt more times does.
The third is causality. Did the work I did move anything? This is the expensive one, and it is the only one of the three that supports a spending decision. It needs prompts, repeats, a group of prompts you deliberately did not work, a fixed window, and a distribution to read the difference against. Almost every argument about prompt counts is really an argument about somebody wanting the third answer at the first answer's price.
Three questions people mean by how many prompts, and what each one needs
| The question | The number that answers it | What answering it lets you say | Source |
|---|---|---|---|
| Which questions am I absent from? | Prompt count. Repeats barely matter, one pass tells you where the zeroes are. | A content queue. This is the cheapest of the three and it is genuinely useful. | derived |
| How reliable is this one prompt's number? | Repeat count only. At five repeats the hit rate carries a standard error of 0.224. | Whether a single row on your dashboard should be read at all. | derived |
| Did my work move anything? | Both, plus a held back group and a fixed window. This is the expensive one. | A spending decision. It is the only one of the three that supports renewing a budget. | derived |
as of 2026-09-02
Method: Derived from the design rather than measured on a programme. The middle row's 0.224 is the standard error of a proportion at the worst case, the square root of 0.25 divided by 5. Falsify the split by finding a design in which raising the repeat count improves the third answer without any change in prompt count, which the arithmetic in this post says cannot happen.
The confusion is not accidental and it is not anybody's fault in particular. All three produce a percentage, all three go on the same slide, and all three get called visibility. But the first is a description, the second is a property of the instrument, and only the third is a result. We wrote the full instrument out in the procedure and proof runbook for tracking AI visibility, and this post is the sizing chapter of it.
A recommended prompt count is a claim about somebody else's variance. The only number that can size your set is the one your own prompts produce when you ask them twice.
Step zero, measure your own instability before you size anything
Do not take a prompt count from a post, including this one. Measure the number that every sizing decision divides by, which is how much your own prompts disagree with themselves when nothing has been done to them.
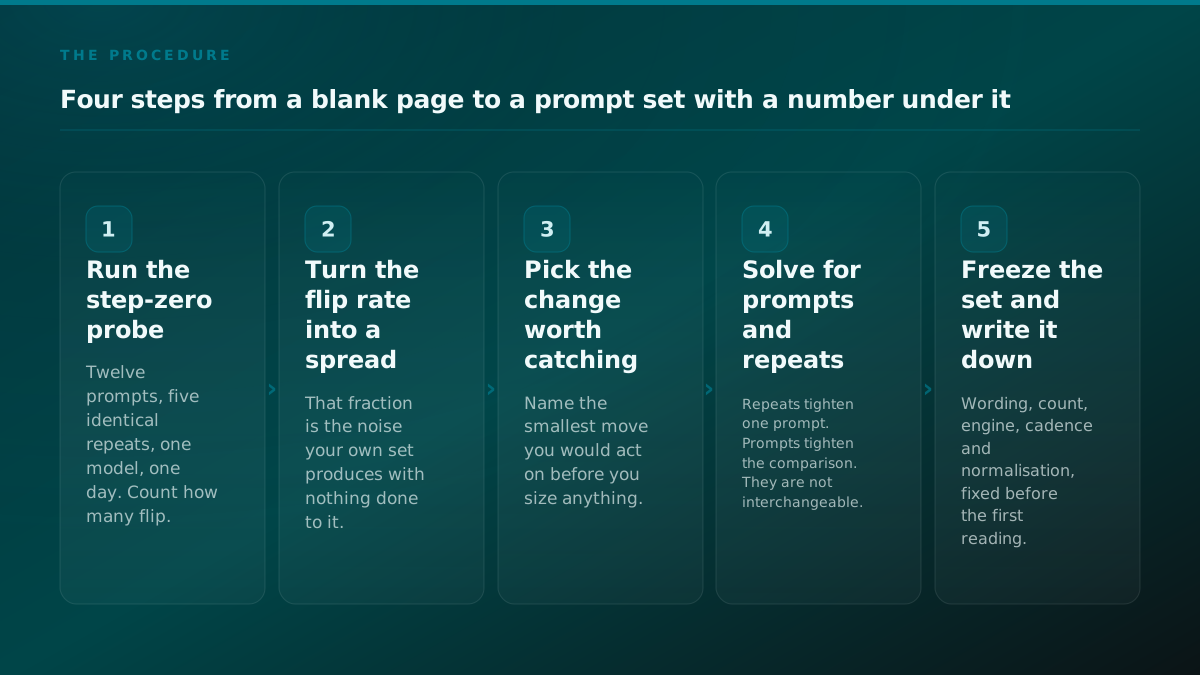
The probe is small. Take ten to fifteen prompts you already care about. Ask each of them five times, identically, on one model, on one day, with no changes between runs. Record the outcome each time. Count how many prompts produced a different outcome across their own repeats.
That count over the total is your instability rate. Ours was seven over twelve, which is 58.3 percent. It cost sixty calls and about twenty minutes of wall clock, and it is the single most useful number produced in the first month of any measurement programme.
Three things follow immediately from that number, and none of them is available to a team that skipped the probe.
The first is a floor on repeats. If most of your prompts flip, one ask per prompt is not a measurement, it is a sample of size one from a distribution you have not characterised. Five repeats is the point at which a proportion becomes computable at all, and it is a floor rather than a target.
The second is a sanity check on everything downstream. A high instability rate says the noise in your set is large, which means the change you need to see has to be larger still, which means your design has to be bigger. A low rate is genuinely good news and sizes the whole programme down. Either way, you now know which case you are in.
The third is a lie detector for vendor claims. If a tool reports a weekly visibility score to one decimal place off a small prompt set with a single pass, the decimal place is decoration. Your own instability rate tells you exactly how much of that number is real.
The step-zero probe, and what each part of it costs
| Component | What we ran | Cost | Source |
|---|---|---|---|
| Prompts | 12 money questions, unbranded, written before any measurement | One afternoon of writing, and it is reused for the whole programme. | measured |
| Repeats | 5 identical asks per prompt, same wording, same model, same day | 60 calls in total. | measured |
| Result | 60 of 60 calls returned, 7 of the 12 prompts changed outcome | An instability rate of 58.3 percent, which is the input to everything below. | measured |
| What it replaces | A recommended prompt count taken from somebody else's post | Nothing, because the recommended number was never measured on your prompts. | derived |
as of 2026-09-02
Method: The first three rows are our own run and are published with their numbers. 7 divided by 12 is 0.5833, which is the 58.3 percent figure. What would falsify the probe is running it on your own set and finding a much lower flip rate, which is a real and welcome outcome: it means fewer repeats buy you the same stability, and the rest of this post sizes down accordingly.
One caution about the probe itself, because it has a failure mode. Run it on one model on one day. If you spread it across two days or two model versions, you have measured instability plus drift plus whatever changed in between, and you will not be able to separate them. The probe answers one narrow question and it answers it only if nothing else is allowed to move.
What one prompt's number is actually worth at five repeats
Here is the part that surprises people who have been reading these dashboards for a year.
A prompt asked five times can produce exactly six numbers. Zero, zero point two, zero point four, zero point six, zero point eight, or one. That is the whole range of values available to it. There is no zero point three five. There is no zero point four seven. The instrument physically cannot express one, because a proportion over five trials moves in steps of one fifth.
So when a dashboard shows you a prompt at 47 percent, either it is aggregating across something it has not told you about, or it is rounding a number that came from a much larger denominator, or it is displaying a precision the underlying data does not have.
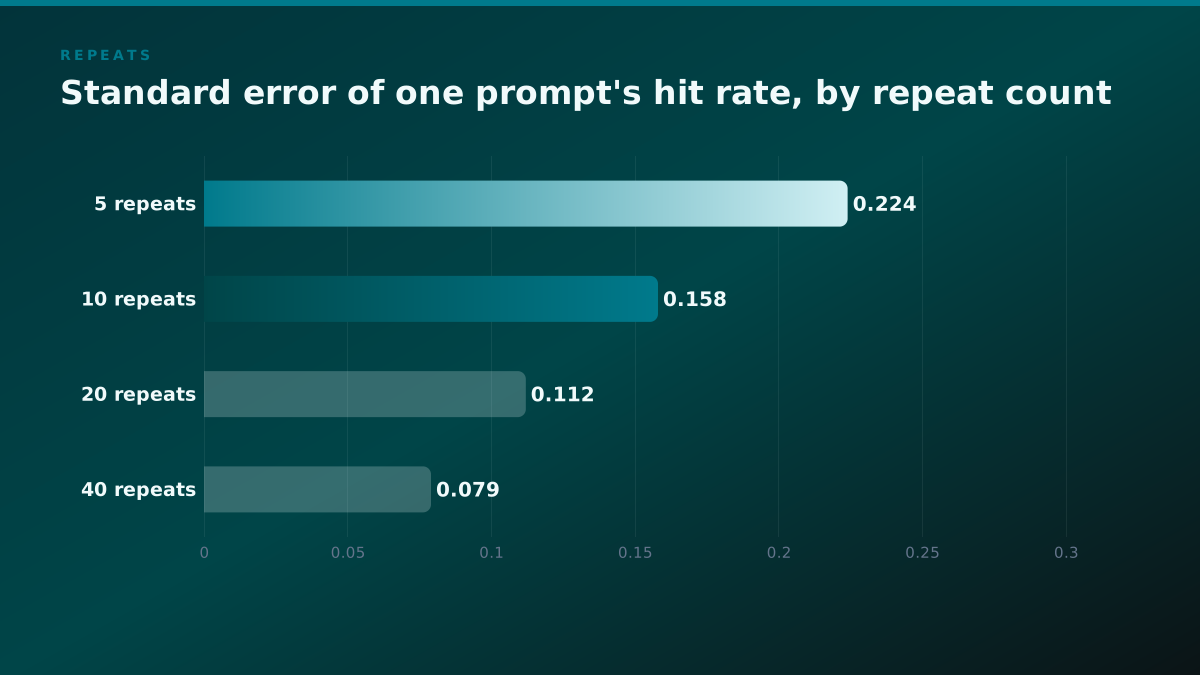
Now the spread. The standard error of a proportion is the square root of p times one minus p, divided by the number of trials. At the worst case, where the true rate is one half, five repeats gives 0.224. Multiply by 1.96 for a conventional interval and you get plus or minus 0.438.
Read that again. A single prompt measured five times carries an interval nearly as wide as the entire scale it is measured on. The honest reading of a prompt at 0.6 with five repeats is that its true rate is somewhere between about 0.16 and slightly above 1.0, which is to say somewhere.
What one prompt's hit rate is worth, by repeat count
| Repeats | Standard error at the worst case | Width of the 95 percent interval | Values the rate can take at all | Source |
|---|---|---|---|---|
| 5 | 0.224 | plus or minus 0.438 | 6 | derived |
| 10 | 0.158 | plus or minus 0.310 | 11 | derived |
| 20 | 0.112 | plus or minus 0.219 | 21 | derived |
| 40 | 0.079 | plus or minus 0.155 | 41 | derived |
as of 2026-09-02
Method: Pure binomial arithmetic, so derived and checkable in one line each. The standard error is the square root of p times one minus p divided by the repeat count, evaluated at p equal to 0.5, which is the widest case. The interval is 1.96 times that. The value count is the repeat count plus one, because a proportion over 5 trials can only be 0, 0.2, 0.4, 0.6, 0.8 or 1.0. What would falsify the table is a prompt whose true rate sits near 0 or 1, where the real spread is narrower than the worst case shown here.
Repeats
Standard error of one prompt's hit rate, by repeat count
| Point | Value (standard error) |
|---|---|
| 5 repeats | 0.224 standard error |
| 10 repeats | 0.158 standard error |
| 20 repeats | 0.112 standard error |
| 40 repeats | 0.079 standard error |
Twenty repeats brings the standard error to 0.112 and the interval to plus or minus 0.219, which is a genuinely different instrument. Forty brings it to 0.079 and plus or minus 0.155. The curve flattens, which is the important structural fact: going from five repeats to ten buys you more than going from twenty to forty. Repeats stop being the cheap lever quite early.
The granularity point, which nobody mentions
Granularity and precision are different problems and repeats fix both, but they fix them at different rates and they fail differently.
Precision failing means your number has a wide interval and you know it, provided somebody computed the interval. Granularity failing means your number is quantised so coarsely that small movements are invisible even in principle. A prompt whose true citation rate goes from 0.30 to 0.38, which is a real improvement, cannot show that at five repeats. It will read 0.2 or 0.4 both before and after, and which one you get is a coin flip.
This is why aggregating across prompts helps. The mean of twelve coarse proportions is much less coarse than any one of them. But it only helps in one direction: it fixes the arm-level number and leaves every individual row on your dashboard exactly as unreadable as it was. If your reporting shows per-prompt rows, and almost all of it does, those rows are the coarsest thing in the report and they are the part stakeholders point at.
Repeats buy precision, prompts buy detection
This is the part that has to be understood before any budget conversation, and it is the part the whole category gets backwards.
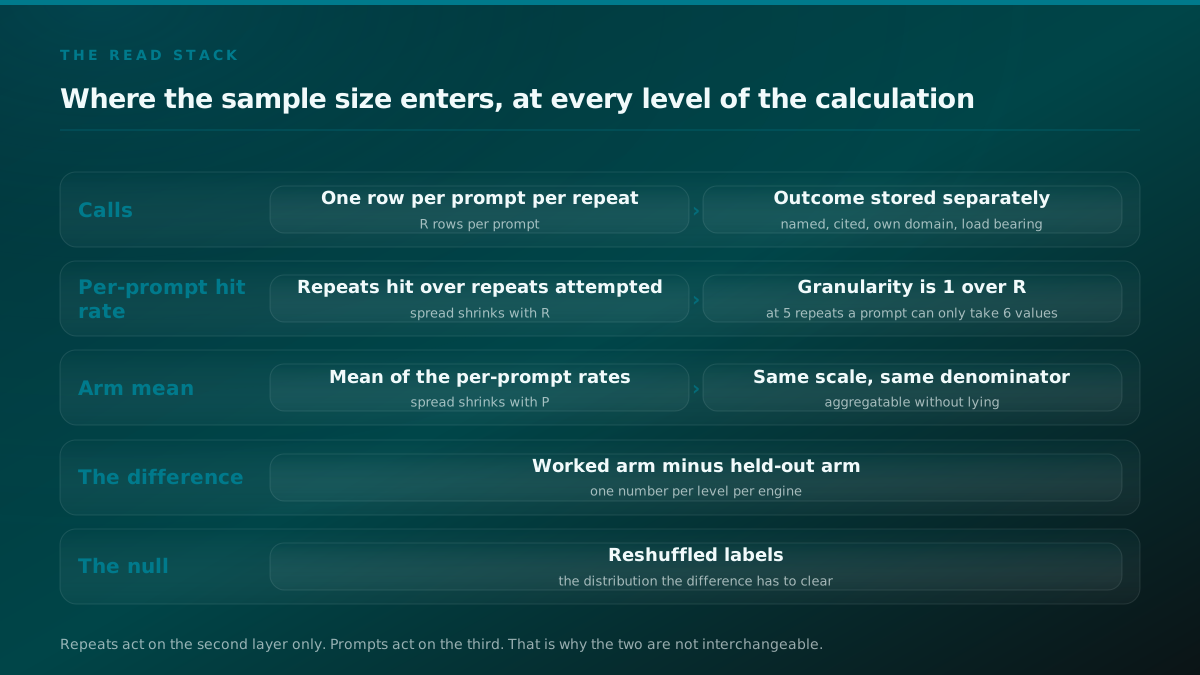
Repeats and prompts do not do the same job. They act on different layers of the same calculation, and no amount of one substitutes for the other.
Repeats act inside a prompt. Asking one question forty times instead of five gives you a much better estimate of that question's citation rate. It does nothing else. You still have one question.
Prompts act across the arm. The number a spending decision rests on is the difference between the mean of the prompts you worked and the mean of the prompts you held back. That difference gets tighter when there are more prompts in each arm, and it barely notices how many times each individual prompt was asked once you are past the point where a proportion is computable at all.
The two levers
Repeats and prompts act on different layers of the same calculation
- CallsOne row per prompt per repeat. The only thing your invoice counts.
- One prompt's hit rateRepeats hit over repeats attempted. Repeats act here and nowhere else.
- The arm meanThe mean of those rates across the prompts in one arm. Prompts act here.
- The differenceWorked arm minus held back arm. This is the number a decision rests on.
- CallsOne prompt's hit rategroup by prompt
- One prompt's hit rateThe arm meanmean across prompts
- The arm meanThe differencesubtract
- CallsThe arm meanbudget constraint
Say the sentence a different way. If you asked twelve prompts one thousand times each, you would have twelve exquisitely precise numbers. Split into two arms, that is six numbers on each side. Six numbers do not make a comparison, no matter how precisely each one was measured. The uncertainty in the difference is driven by how much the prompts differ from each other, and repeating them does not change how much they differ from each other.
Conversely, if you asked four hundred prompts once each, you would have four hundred extremely noisy numbers, and their means would still be reasonably stable because averaging four hundred noisy things works. The problem there is different: with a single repeat you cannot compute a proportion at all, and you cannot tell a prompt that is genuinely borderline from a prompt that is genuinely stable, which matters for everything you do next.
So the answer is not one or the other. It is that repeats have a floor and prompts have a slope. Get repeats above the floor where a proportion means something, which our own instability rate puts at five and where we would rather see ten to twenty, and then spend everything else on prompts.
There is one honest exception worth naming. If your set is genuinely tiny and cannot be grown, because you sell into a narrow category where there are only fifteen real buyer questions, then the arm-level comparison is not available to you at any budget and you should stop trying to build one. Spend the calls on repeats instead, get very tight per-prompt numbers, and report per-prompt movement with intervals attached. That is a smaller claim and it is defensible, which is more than most reporting manages.
The power ladder, and what happened when we checked its own arithmetic
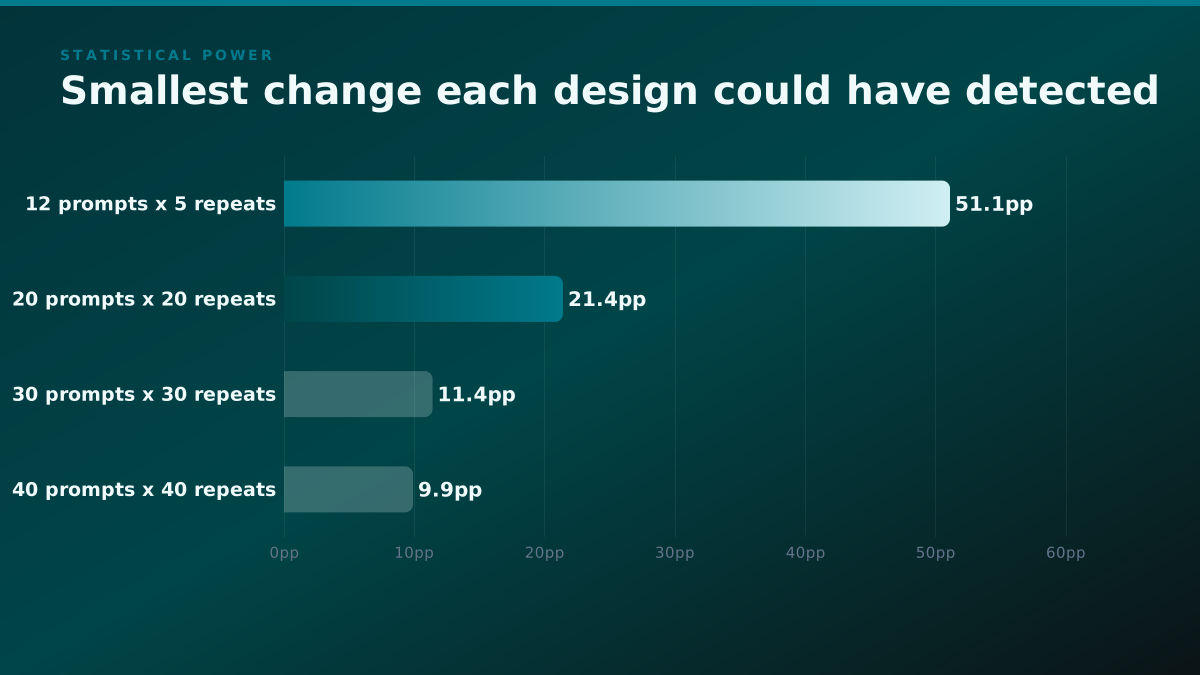
We published a ladder of minimum detectable lifts computed from the variance in our own step-zero run. The four points are 51.1 percentage points at twelve prompts by five repeats, 21.4 at twenty by twenty, 11.4 at thirty by thirty, and 9.9 at forty by forty.
Statistical power
Smallest change each design could have detected
| Point | Value (percentage points) |
|---|---|
| 12 prompts by 5 repeats | 51.1 percentage points |
| 20 prompts by 20 repeats | 21.4 percentage points |
| 30 prompts by 30 repeats | 11.4 percentage points |
| 40 prompts by 40 repeats | 9.9 percentage points |
Those are the numbers, and they are the reason we do not publish a causal lift figure of our own. Our pilot was the first design on that list, which cannot see anything smaller than about half the scale.
But it is worth doing something with those four points rather than just quoting them, because the shape they make answers the question this post is about.
The obvious guess is that detection scales with the square root of the total number of calls, which is how most sampling arithmetic behaves. Twelve by five is sixty calls, twenty by twenty is four hundred, thirty by thirty is nine hundred, forty by forty is sixteen hundred. If the guess were right, you could take the 51.1 anchor and divide it by the square root of the call ratio to predict the rest.
Do it and you get 19.8 for the four hundred call design against a published 21.4, and 13.2 for the nine hundred call design against a published 11.4. The sixteen hundred call design comes out at 9.9, which matches exactly.
We checked the published power ladder against a simple square-root law, and it does not fit
| Design | Calls | Published floor | What a pure call-count law predicts | Source |
|---|---|---|---|---|
| 12 prompts by 5 repeats | 60 | 51.1pp | the anchor, by construction | published |
| 20 prompts by 20 repeats | 400 | 21.4pp | 19.8pp, which is 1.6 too optimistic | derived |
| 30 prompts by 30 repeats | 900 | 11.4pp | 13.2pp, which is 1.8 too pessimistic | derived |
| 40 prompts by 40 repeats | 1,600 | 9.9pp | 9.9pp, an exact match | derived |
as of 2026-09-02
Method: The published floors are ours, from the power analysis on our own run. The prediction column is our arithmetic here: take 51.1 and divide by the square root of the call ratio against the 60-call anchor. It matches at 1,600 calls and misses by roughly 1.6 and 1.8 points in the middle, which is the finding. If the floor depended only on the total number of calls, all four would land on the line. They do not, so the split between prompts and repeats is doing work of its own, which is the whole argument of this post. Falsify it by publishing a power curve from the same variance that does sit on a single call-count line.
Two points on the line, two points off it by about 1.6 and 1.8 percentage points in opposite directions. That is the finding, and it is a small one that matters a lot: the detection floor does not depend only on how many calls you buy. It depends on how you split them between prompts and repeats. If total calls were the whole story, all four points would sit on one curve, and they do not.
Which is the same thing the previous section argued from first principles, arriving now from the other direction. Prompts and repeats are not interchangeable currency. A design of eighty prompts by twenty repeats and a design of forty prompts by forty repeats cost exactly the same sixteen hundred calls and they are not equally good at the same job.
If you want one rule out of this section, it is this. When you cannot afford the design you want, take the cut out of repeats before you take it out of prompts, as long as repeats stay above the floor where a proportion is computable. Cutting prompts costs you the comparison. Cutting repeats costs you precision on rows nobody is going to make a decision from anyway.
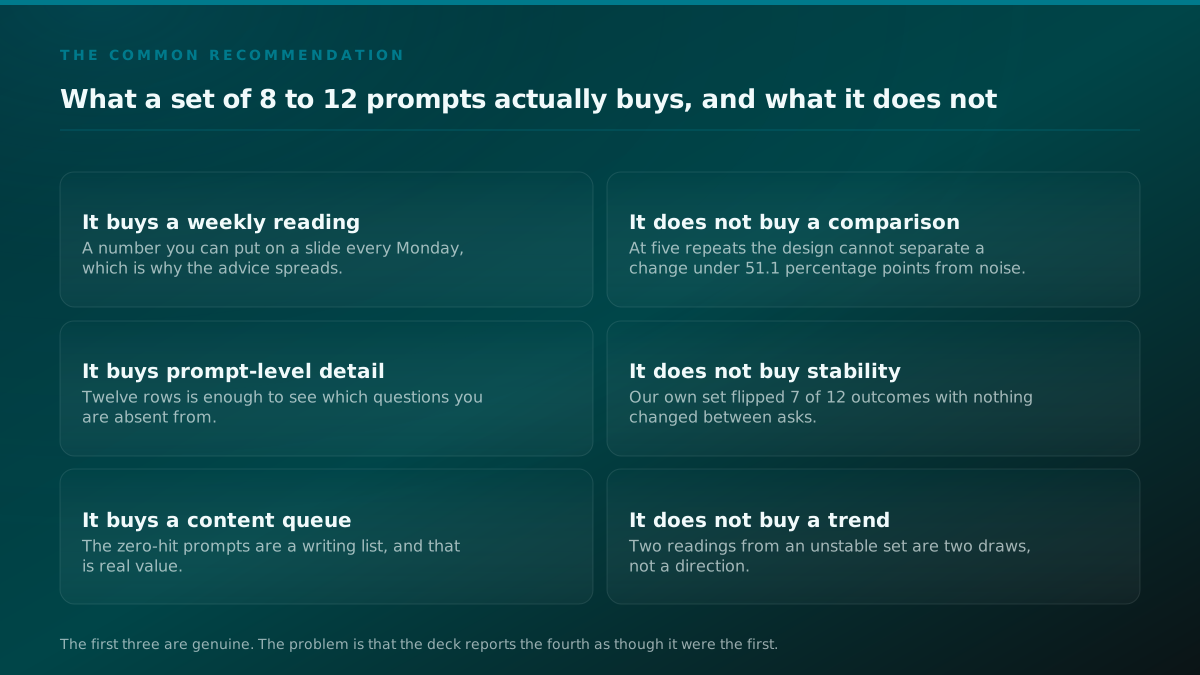
What a set of 8 to 12 prompts actually buys, stated fairly
We should be precise about what we are and are not saying, because a small prompt set is not worthless and pretending otherwise would be its own kind of dishonesty.
A set of eight to twelve prompts, read once, buys three real things.
It buys an absence map. You learn which of your buyers' questions produce answers that never mention you. That is genuinely valuable and it does not need statistics, because a zero across every repeat is a zero and does not require an interval.
It buys a content queue. Every prompt sitting at zero is a page you have not written or a page that exists and is not being retrieved. That queue is the most actionable output of any measurement programme, and a twelve prompt set produces it perfectly well.
It buys a weekly number for a stakeholder, and this is the one that causes the damage. The number exists, it updates, it goes on a slide. Nothing about the number says how much of its movement is the instrument, and by the time somebody asks, six months of that chart is sitting in a shared drive being read as a trend.
A set of 8 to 12 prompts, scored honestly against what it is asked to do
| What it is used for | Does it work | Why | Source |
|---|---|---|---|
| Finding the questions you are absent from | Yes | A zero is a zero. Absence is the one reading that does not need a tight interval. | derived |
| Building a content queue | Yes | The zero-hit prompts are a writing list, and that is a real deliverable. | derived |
| Showing a stakeholder a number every week | Yes, and this is the problem | The number exists and updates. Nothing about it says how much of the movement is the instrument. | derived |
| Saying whether a week-over-week move is real | No | At 8 to 12 prompts with a handful of repeats the design sits at or below our 60-call anchor, whose floor is 51.1 percentage points. | derived |
| Comparing two approaches against each other | No | Splitting 12 prompts into two arms leaves 6 per arm, and 6 proportions do not make a comparison. | derived |
as of 2026-09-02
Method: Derived by putting the common recommendation against our own published power figures rather than against an opinion. The last two rows rest on one number: the 12 prompt by 5 repeat design has a minimum detectable lift of 51.1 percentage points. Falsify the last two rows by measuring an instability rate far below ours on your own set, which moves the floor down and can make a small set sufficient.
What it does not buy is a comparison. Split twelve prompts into a worked arm and a held back arm and you have six and six. Six proportions per side, each of them quantised into six possible values at five repeats, differenced against each other, and read against a noise distribution whose standard deviation we measured at 0.215. There is no arrangement of that data that supports a claim about causation.
The practical version of this: keep the twelve prompt set if it is doing the first two jobs. Just stop presenting its weekly delta as a result, and stop letting a flat quarter from it cancel a programme. Those are two different failures and they cost real money in opposite directions.
The budget is one number, and four things multiply into it
Everything above collapses into one line of arithmetic. Prompts times repeats times engines times readings equals calls, and calls is what your provider bills you for.
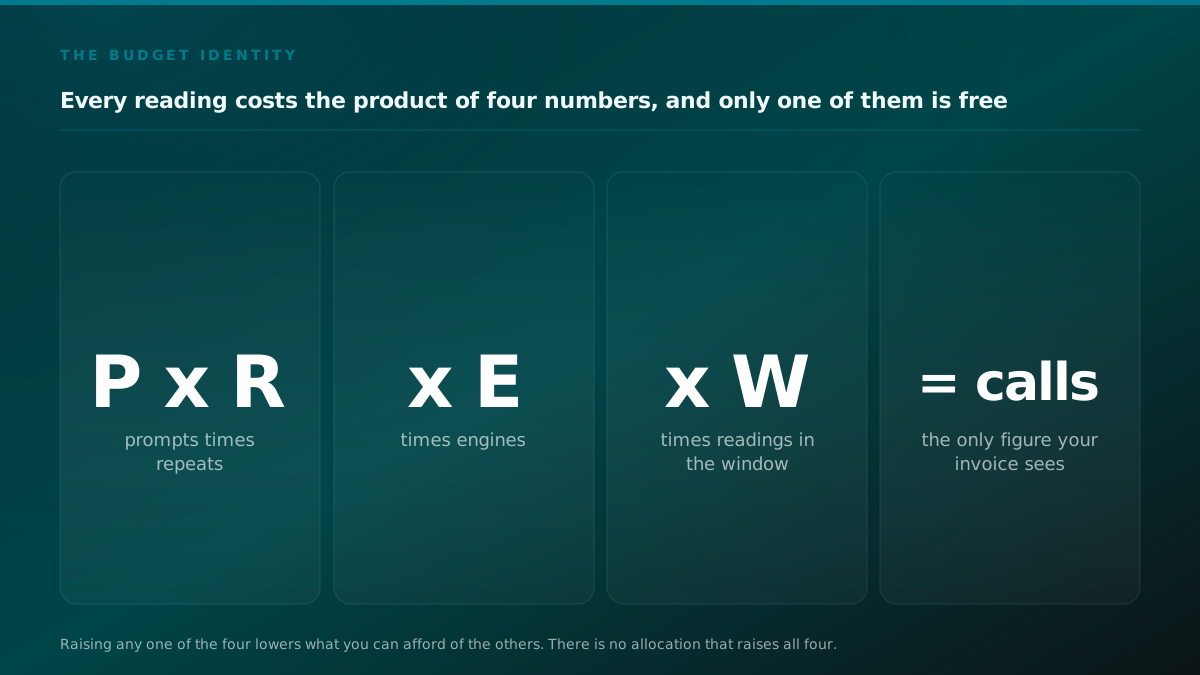
Every dimension you add spends the same pool. Adding a second assistant does not cost a bit more, it doubles the whole design. Adding a weekly reading instead of a monthly one multiplies by roughly four. Raising repeats from five to twenty multiplies by four. The four numbers are not independent knobs, they are factors in one product, and the product is fixed by whatever you are willing to spend.
The picture above makes the equality visible before it makes the difference visible, which is the part that is easy to lose. Two allocations that cost identically are not equally useful, and the whole sizing question is which shape of the same spend answers your question.
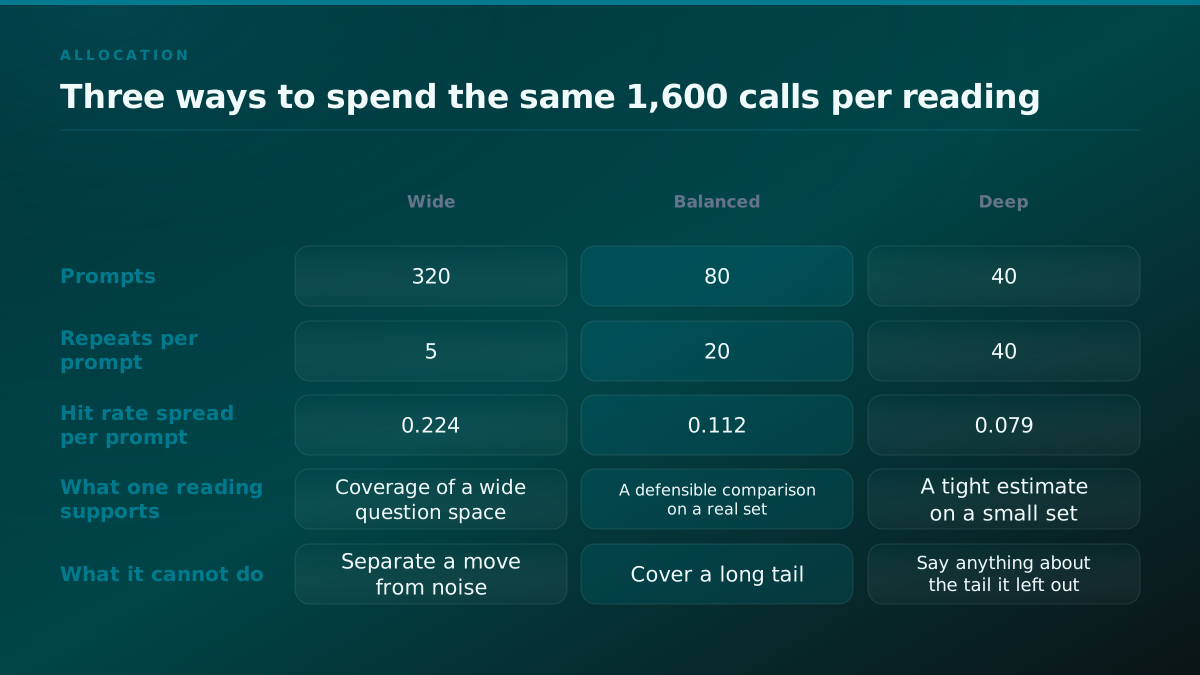
Take sixteen hundred calls per reading and lay out three ways to spend them.
Wide: three hundred and twenty prompts, five repeats each. Enormous coverage. Every prompt carries a standard error of 0.224 and six possible values. Excellent absence map, no comparison.
Balanced: eighty prompts, twenty repeats each. A real working set with an honest per-prompt spread of 0.112, and forty prompts per arm after the split, which is a comparison you can defend.
Deep: forty prompts, forty repeats each. The tightest per-prompt numbers available at this budget, twenty prompts per arm, and total blindness to everything outside forty questions.
Comparison
Three ways to spend the same 1,600 calls in one reading
| Wide, 320 prompts by 5 | Balanced, 80 prompts by 20 | Deep, 40 prompts by 40 | |
|---|---|---|---|
| What one prompt's number is worth | A standard error of 0.224 and only six possible values. | A standard error of 0.112 and 21 possible values. | A standard error of 0.079 and 41 possible values. |
| What the set covers | A wide question space, including the long tail nobody else measures. | A real working set, with the tail deliberately excluded. | A small set. Everything outside it is invisible and you should say so. |
| What one reading supports | A map of where you are absent. No comparison at all. | A defensible comparison on the questions you chose to care about. | The tightest per-prompt estimate available at this budget. |
| What it costs you | Any ability to separate a move from noise, which is usually the reason the budget was approved. | Coverage of the tail, which is a genuine loss and should be stated in the report. | Coverage of everything outside 40 questions, which is most of the buying language. |
We would spend in the middle, and the middle is not free. Choosing it means genuinely not knowing what happens on the questions you left out, which should be stated in the report rather than quietly absorbed. A team whose buyers ask a genuinely wide variety of things needs a bigger budget, not a cleverer allocation of a small one.
The one allocation we would argue against in all cases is spreading a small budget across four assistants. They retrieve differently, they disagree with each other, and a number blended across them has a spread that belongs to none of them. If the budget forces a choice, sample one assistant properly rather than four of them thinly, because a well sampled reading of one supports a claim and four thin ones support nothing. That is a scoping decision and it belongs in the plan, alongside everything else in measuring answer engine optimization lift.
1 repeat per query, so no query has an error bar at all
5 repeats per query, so each query carries its own error bar
20 calls either way
Same spend, same week, same engine. Only the second allocation can tell a move from noise, and our own step zero run is the reason: 12 queries asked 5 times each, 7 of them changed outcome with nothing altered between runs.
Sizing worked end to end, from one measured number
Abstract arithmetic is easy to agree with and hard to use, so here is the whole thing on one page with real numbers in it.
Start with the probe. Twelve prompts, five identical repeats each, one model, one day. Seven flipped. Instability rate 58.3 percent. That took sixty calls.
Now name the effect. This is the step teams skip and it is the only step that cannot be computed. What is the smallest change that would alter what you do next quarter? Not the change you hope for. The change that would make you keep funding this, or stop. For most programmes the honest answer is around ten percentage points of citation share, because that is roughly the size of a good quarter of work and it is large enough to survive a sceptical read.
Write that number down, dated, before you look at any comparison. A team that picks its acceptable effect after seeing the result will pick whatever the result was, every time, and nobody involved will feel like they cheated.
Now read the floor off the ladder. Fifty one point one at twelve by five, 21.4 at twenty by twenty, 11.4 at thirty by thirty, 9.9 at forty by forty. Your named effect is ten points. Only the last design clears it, and it clears it by a tenth of a point, which is uncomfortably tight.
The sheet
One page of arithmetic, filled in before the first call
58.3%
Measured instability
10pp
Effect worth acting on
40 by 40
Design that clears it
1,600
Calls per reading
- Prompt wording, frozen and dated
- Repeat count, chosen from the measured spread
- Arm assignment, seeded and stamped per row
- Decision date, written before the baseline
- Normalisation function, written once
- A projected lift numberThere is none. We publish no causal lift figure, because the design that produced our numbers could not have measured one, and quoting a projection on a sizing sheet is how a projection becomes a result three months later.
Convert to calls. Forty prompts by forty repeats on one assistant is sixteen hundred calls per reading. A minimum defensible window is a baseline reading and a closing reading, which is thirty two hundred calls. If you want a mid-window integrity check that you have committed in advance not to make a decision from, call it forty eight hundred.
Check the split. Forty prompts divided into two arms is twenty worked and twenty held back. Twenty is the smallest arm we would defend, and it is smaller than we would like.
A sizing sheet, worked end to end from one instability rate
| Step | Input | Output | Source |
|---|---|---|---|
| Measure instability | 12 prompts, 5 identical repeats, one model, one day | 7 of 12 flipped, so 58.3 percent | measured |
| Name the change worth acting on | The smallest move that would change what you do next quarter | 10 percentage points, which is a normal programme result | unknown |
| Read the floor off the ladder | 51.1 at 12 by 5, 21.4 at 20 by 20, 11.4 at 30 by 30, 9.9 at 40 by 40 | Only 40 by 40 clears 10 | published |
| Convert to calls | 40 prompts times 40 repeats times one engine | 1,600 calls per reading | derived |
| Convert to a window | One baseline reading plus one closing reading | 3,200 calls for the simplest defensible window | derived |
| Check the split | 40 prompts split into two arms | 20 worked and 20 held back, which is the smallest arm we would defend | derived |
as of 2026-09-02
Method: Row one is our own run. Row two is tagged unknown because the acceptable effect size is a business decision and nobody can measure it for you, which is exactly why it has to be written down before the design is chosen. Row three is our published ladder. Rows four to six are arithmetic: 40 times 40 is 1,600, twice that is 3,200, and 40 split evenly is 20 per arm. Falsify the sheet by choosing a larger acceptable effect, which legitimately sizes the design down.
Then look at the result of the whole exercise honestly, because there is a good chance it says something you did not want to hear. If your budget tops out at four hundred calls per reading, the arithmetic has told you that a ten point effect is not detectable by anything you can afford. That is not a failure of the exercise. That is the exercise working. The alternative is spending the same four hundred calls, getting a null, and reporting it as evidence the work did not do anything, which is a much more expensive mistake than knowing in advance that you could not have seen it.
There is a version of this conversation that goes better, and it goes better because the arithmetic happened first. You walk in and say: to prove a ten point move we need this design and this many calls, here is the cost. To prove a twenty five point move we need this smaller one. Below that we can tell you where you are absent and we cannot tell you whether we caused anything. Pick. Every one of those sentences is defensible and none of them requires anybody to trust you.
Cadence, and why weekly reading costs you power you already paid for
Reading interval feels like a scheduling decision. It is a statistical one, and it is the one that quietly destroys the most programmes.
Extra readings do not add detection power. Power comes from the size of the design and the length of the window, not from how often you look at it. What extra readings add is chances to be wrong.
Set a threshold of two standard deviations, which against our own measured null of 0.215 puts the bar at about 0.43. At a single look, that threshold gives you roughly a five percent chance of crossing it when nothing happened. That is what the threshold was chosen to give you.
Look twice and it is about 9.8 percent. Look four times and about 18.5 percent. Read it every week for a quarter, which is twelve looks and exactly what almost every team does, and the chance of at least one false crossing is about 46 percent.
What reading the result early costs, at a two standard deviation threshold
| Times you look | Chance of at least one false crossing | What it means in practice | Source |
|---|---|---|---|
| Once, at the end of the window | about 5 percent | The number the threshold was chosen to give you. | derived |
| Twice | about 9.8 percent | Already double, for a habit nobody writes down. | derived |
| Four times | about 18.5 percent | Roughly one programme in five reports a crossing that was not there. | derived |
| Weekly for a quarter | about 46 percent | A coin flip. At this point the threshold has stopped doing anything at all. | derived |
as of 2026-09-02
Method: Derived arithmetic under an explicit and deliberately generous assumption: that each look is independent, so the chance of at least one crossing is one minus 0.95 raised to the number of looks. Real weekly readings are correlated, so the true figures are lower than these. The direction is what matters and the direction does not depend on the assumption. Falsify it by simulating correlated weekly readings from your own data and finding the inflation absent, which we have not seen.
Those figures assume each look is independent, which real weekly readings are not, so the true numbers are lower than the ones above. We are stating the assumption because it is generous to the practice we are criticising and the conclusion survives anyway. The direction is not in doubt even if the exact figure is.
Here is what makes this expensive rather than merely academic. Nobody peeks neutrally. A team reads the dashboard every Monday, and the week the number happens to jump they tell the client, and the week it happens to sag somebody asks whether the strategy is working. Both of those are decisions made from a crossing that the design cannot distinguish from noise, and the fact that they are informal decisions rather than a formal stopping rule makes them worse, not better, because nothing about them is written down.
STEPS
The order the decisions have to happen in
Write the prompts, then stop
One afternoon
Unbranded, buyer-shaped, dated. No counting, no sizing, no measurement yet. A set written after you have seen a number is a set selected by the number.
Run the instability probe
60 to 75 calls
Ten to fifteen prompts, five identical repeats, one model, one day. Count the flips. This is the one step in the sequence that produces an input rather than an output.
Name the effect worth acting on
Five minutes
Before you see any comparison. Ten percentage points is a normal answer. Writing it down afterwards is how a design gets sized to the result it produced.
Size the design
Ten minutes
Read the floor off the power ladder, pick the smallest design that clears your named effect, and convert it to calls. If nothing you can afford clears it, that is the finding.
Split, seed and freeze
One hour
Half the prompts worked, half held back, assignment seeded and stamped on every row. Then the set does not change until the window closes.
Read once, at the decision date
The whole window
Not weekly. Every extra look is another chance to cross a threshold on noise, and the cost of that habit compounds faster than most people expect.
The fix costs nothing. Write the decision date on the plan before the baseline reading. Look at the data in between as much as you like for integrity checks, that failures are not piling up on one arm, that the model version string has not changed, that no prompt has started returning refusals. Do not compute the difference between arms until the window closes. The difference is the one number that is very hard to give up once you have seen it.
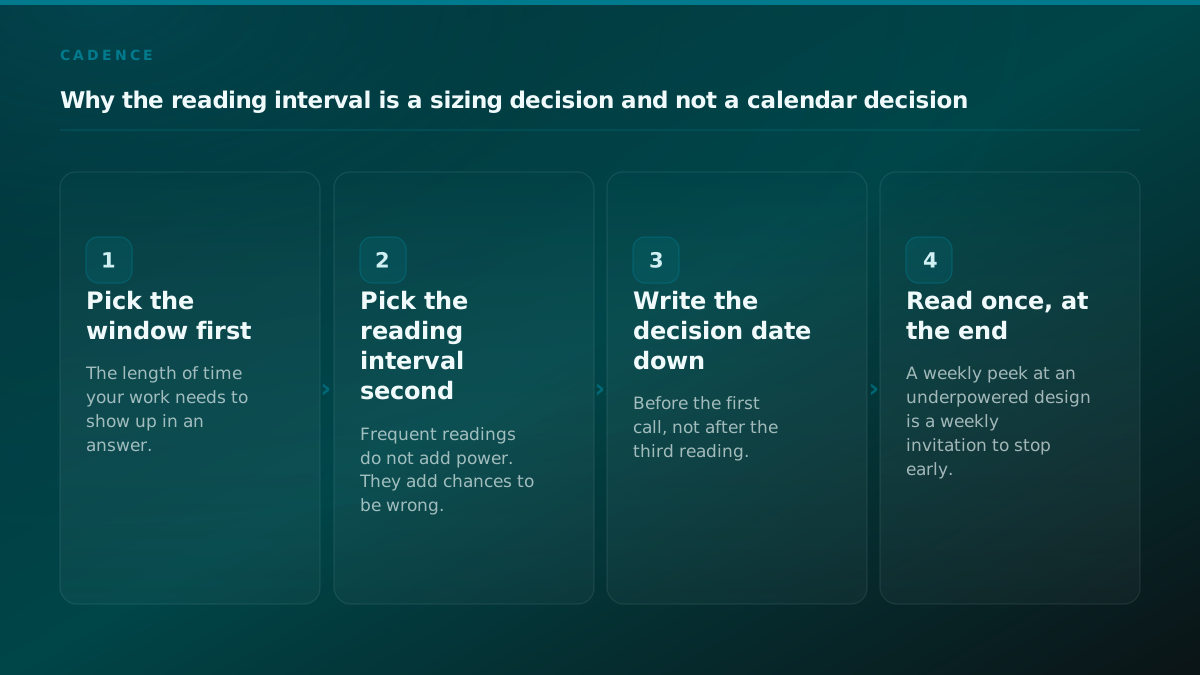
There is a second cadence question underneath the first one, which is how long the window itself should be. That is not a statistical question, it is a question about how long your work takes to show up in a retrieved answer, and it varies enormously by what you shipped. A new comparison page and a schema change land on different timelines. Pick the window from the mechanism, then pick the design to fit the window, and never the other way round.
The bar, or what a difference looks like when you did nothing
A sample size is only meaningful against a threshold, and the threshold is the part most teams import from somewhere else instead of computing.
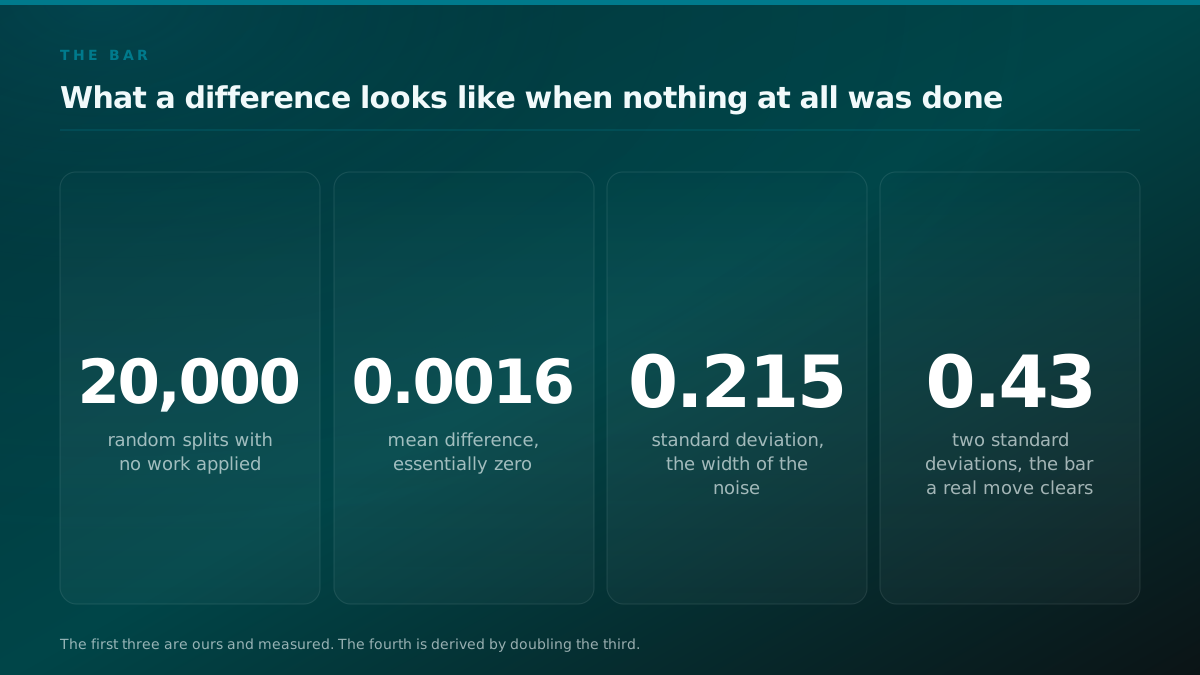
We computed ours. Take the same prompt set, apply no intervention at all, throw away which arm each prompt was really in, reassign the labels at random at the prompt level, and recompute the difference between arms. Then do it twenty thousand times. What comes out is the distribution of differences that your own instrument produces when nothing whatsoever has been done.
Ours centred on zero, with a mean of plus or minus 0.0016 and a standard deviation of 0.215.
The zero mean is the kill test. If that distribution had not centred on zero, the instrument would be manufacturing a difference out of nothing and every result it ever produced would be void. It centred on zero, so the instrument is not lying to us, which is the least a measurement has to do before anyone argues about its size.
The standard deviation is the part that matters for sizing. Zero point two one five is the width of the noise. A conventional two standard deviation bar puts a real result at about 0.43, and that is an enormous number: it means a difference between arms has to be forty three points of citation share before this particular set clears its own noise.
The bar a real change has to clear, from our own 20,000 splits
| Quantity | Value | What it means for sizing | Source |
|---|---|---|---|
| Random splits with no work applied | 20,000 | Each one a fake experiment in which, by construction, nothing happened. | measured |
| Mean difference | plus or minus 0.0016 | Essentially zero, which is the design's own kill test. | measured |
| Standard deviation | 0.215 | The width of the noise your set produces on its own. | measured |
| Two standard deviations | about 0.43 | Derived by doubling the row above. A design whose floor sits above this cannot use it. | derived |
as of 2026-09-02
Method: Our own run: 20,000 random splits of our own prompt set with no intervention applied, with the arm difference recomputed under each fake assignment. The first three rows are measured. The last is derived by doubling the third. What would falsify it is a rerun whose mean is not centred on zero, which would invalidate the instrument rather than the result.
Which brings the whole post back to one line. Your prompt set has to be large enough that the noise it produces is smaller than the change you care about, and both halves of that sentence are measurable. The noise is measurable with a permutation test on data you already have. The change you care about has to be named by a human before the fact.
Note what the permutation test needs, because it constrains the design. It shuffles at the prompt level, keeping each prompt's repeats together, which means it needs prompts to shuffle. With six prompts per arm there are very few distinct ways to reassign them, and the null distribution comes out lumpy and unusable. This is the same argument as before wearing different clothes: prompts are what the comparison is made of.
A reading here is inside the shuffles. Indistinguishable from having done nothing.
A reading out here clears its own noise. This is what a result looks like.
Our own run: 20,000 random splits of the same query set with no intervention applied, difference between halves centred on zero, mean plus or minus 0.0016, standard deviation 0.215. The mean being zero is what proves the design is unbiased. The spread is what your result has to clear.
Adding prompts mid-window is how the number gets gamed
There is a failure here that deserves its own section because it is common, it is usually not malicious, and it produces exactly the movement a client is paying to see.
You start with forty prompts. Six weeks in, somebody notices that the brand does well on a whole topic area that is thinly covered in the set, so they add eight prompts covering it. Perfectly reasonable instinct. The dashboard number goes up the following week and everybody is pleased.
Nothing happened. The denominator changed. Eight prompts were added from a region of question space where the brand already wins, so the mean rose for a reason that has nothing to do with any work.
The failure nobody reports
What happens to a comparison when the prompt set changes mid-window
- The frozen setThe prompts you wrote in week zero, and the baseline they produced.
- A prompt is addedAlmost always one you already win, because those are the ones somebody remembers.
- The later setA different instrument wearing the same name and the same dashboard.
- The reported moveArithmetic across two different denominators, presented as one series.
- A number nobody can defendNothing in the reading separates the set change from the work.
- The frozen setA prompt is addedmid-window
- A prompt is addedThe later setsilently
- The frozen setThe reported movebaseline
- The later setThe reported movecurrent
- The reported moveA number nobody can defendreported as lift
The reason this is a bias rather than merely noise is that the added prompts are never a random sample. Nobody wakes up and adds eight prompts a brand is invisible on. The prompts people remember to add are the ones somebody just saw a good answer for, which means the selection is correlated with the outcome, which means the direction of the error is always the same direction as the reported improvement.
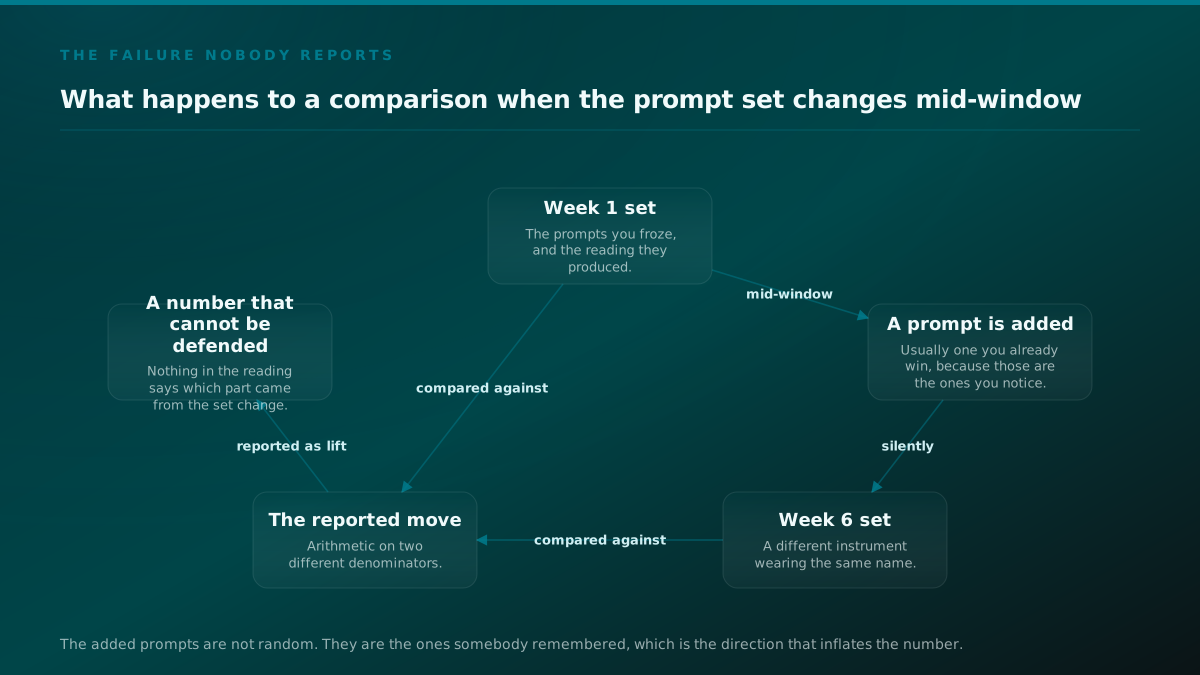
Practitioners describe doing exactly this and reporting the result as a visibility improvement. Read as a description of the work it is honest. Read as a measurement it is a denominator change wearing the clothes of a result, and no amount of downstream statistics recovers from it, because the two arms are no longer being compared on the same set of questions.
From the field
The cheapest way to improve a visibility number is to change the set
Practitioners describe adding prompts in topic areas where a brand already wins and reporting the resulting rise as an improvement. Read as measurement that is a denominator change, not a result. It is also the single strongest argument for freezing the set before day zero, because the freeze is the only control that makes the two indistinguishable cases distinguishable, and it costs nothing to apply.
The fix is one rule and it is free. Freeze the set at day zero. If new prompts are worth adding, and they usually are, they start a new cohort with its own baseline and their own window, reported separately. That gives you both things: the comparison stays clean and the new questions get measured. What you cannot do is quietly widen the set and keep the old chart running.
The same logic covers prompts leaving. If an assistant starts refusing a prompt, or a prompt begins returning an error, do not silently drop it. Void it, record the void, and check that the voids are not landing more heavily on one arm than the other. A set that loses four prompts from the worked arm and none from the held back arm is not a smaller set, it is a broken comparison.
Other people have run this check, and their numbers land in the same place
We are not the only ones who have measured this, and it is worth pointing at the independent readings, because a first-party number that nothing corroborates is a weaker claim than one that lines up with other people's.
A practitioner in r/aeo posted a run of the same buying question thirty times in a row. Their reported findings: a different top brand four times out of ten, the full list of recommended brands overlapping only about half the time between one ask and the next, and the top pick still switching one time in four even after turning the randomness settings down as far as they could go. Their own conclusion was that in any contested category it is basically a coin toss.
Their own summary of it, in their words:
The only exception was markets with a clear dominant player. In any contested category, it was basically a coin toss.
That sentence is a sample-size statement wearing a different vocabulary. A coin toss is a distribution with a standard deviation, and the whole of this post is about how many tosses you need before a difference between two coins means anything.
That is a different set, a different category and a different operator, and the shape matches ours. We measured 7 of 12 prompts flipping outcome across five identical repeats. They measured a top-brand change in 4 of 10 asks. Neither of us is measuring exactly the same quantity, so the numbers should not be expected to be equal, but both say the same structural thing: a single ask is a draw, not a reading.
The most useful thing in that thread is not the post, it is the reply setting a methodology floor at twenty to thirty runs per prompt. That is a practitioner arriving at a repeat count from experience rather than from a formula, and it sits comfortably above the five we would call a floor and comfortably below the forty our own power ladder wants for detection.
The same question has been asked at much higher volume. Rand Fishkin put it directly: "If you give ChatGPT the same request for product recommendations 100X, will you ever get the same list twice?" and then, in the next line, "And what does that answer mean for folks who try to track their brand presence in AI tools?" That second sentence is the whole of this post compressed into eighteen words, and it went out to an audience of hundreds of thousands.
Now look at the other end of the range. There are tutorials teaching how to assemble prompt sets of a thousand and upward for tracking a brand across assistants.
Put the two recommendations side by side. Eight to twelve at one end, a thousand and more at the other. Three orders of magnitude apart, both offered as the sensible default, and neither one derived from a stated detection threshold. That gap is not a disagreement about statistics. It is the absence of any statistics at all, which is what makes it possible for both numbers to sound reasonable at the same time.
Neither pole is wrong for every purpose. A thousand prompts read once is a superb absence map and a terrible experiment, since at one repeat there is no proportion under anything. Twelve prompts read forty times each is a decent set of per-prompt estimates and not a comparison. The number that resolves the argument is not a prompt count, it is a detection threshold, and once you have one the prompt count falls out of it.
Your effective prompt count is smaller than your prompt count
One more correction before the cost arithmetic, and it usually moves a design by a factor of two.
Not every prompt in your set can contribute to a change. Sort them into three groups after the first reading.
Saturated prompts are hit on every repeat. They sit at 1.0. They cannot move up, so they can never contribute to a gain, and every call spent on them is a call spent confirming something you already know. They are not useless, since they can detect a loss, but they contribute nothing to the measurement most programmes are trying to make.
Dead prompts are hit on no repeat. They sit at 0.0. In a single window these mostly stay at zero, because the work that moves a prompt off zero is usually publishing something that does not exist yet, and that runs on a slower clock than the window does. They are your content queue, which is valuable, and they are close to inert as measurement.
Unstable prompts are the ones somewhere in the middle, hit on some repeats and not others. Almost all the signal is here, and so is almost all the noise.
Why your effective prompt count is smaller than your prompt count
| Prompt group | Can it move | What it contributes to a comparison | Source |
|---|---|---|---|
| Saturated, hit on every repeat | Not upward | Nothing to a gain. It can only ever record a loss. | derived |
| Never hit, on any repeat | Only if the answer changes category | Little in one window. These are a content problem, not a ranking problem. | derived |
| Unstable, hit on some repeats | Yes, in both directions | Almost all of the signal, and almost all of the noise. | derived |
| A worked example, 12 prompts split 3 saturated, 3 dead, 6 unstable | 6 of 12 | Half the set is doing the work, so the effective design is closer to 6 by 5 than 12 by 5. | unknown |
as of 2026-09-02
Method: The first three rows are derived from what a proportion can do at its bounds. The fourth is tagged unknown because the 3 and 3 split is an illustration and not a measurement of any set, ours included. The arithmetic inside it is checkable, 12 minus 3 minus 3 is 6. Falsify the row by measuring your own distribution, which is the point: it is one column and it is knowable.
So if a twelve prompt set has three saturated and three dead, the working set is six, and the design is much closer to six by five than to twelve by five. The power arithmetic should be run on the movable prompts, not on the total, and almost nobody does this because the total is the number on the invoice.
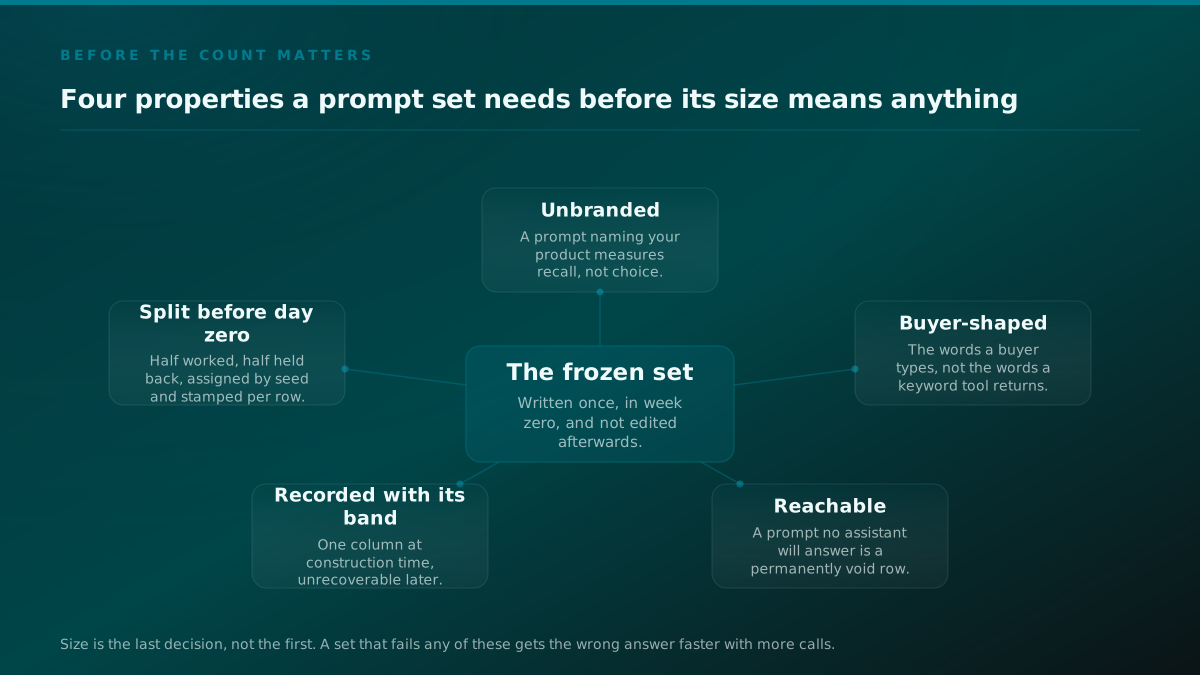
Two consequences follow. First, size up rather than down, because your effective set will be smaller than your nominal one and you will not know by how much until the first reading. Second, look at the distribution at baseline and act on it. A set that comes back mostly saturated is telling you that your prompts are too easy, and a set that comes back mostly dead is telling you they are too hard or too specific. Both are fixable at set-construction time and neither is fixable afterwards. The question of which questions belong in the set at all is a separate piece of work, and for our own buyers it looks like the questions developer tool buyers ask AI.
What the calls actually cost
None of this is expensive in the way people fear, and being concrete about it removes an objection that is usually standing in for a different objection.
Eight prompts at one repeat is eight calls per reading, 416 calls a year at weekly cadence. That is the design most teams are actually running, and it costs approximately nothing, which is the real reason it is popular.
Twelve prompts by five repeats is sixty calls per reading and 3,120 a year weekly.
Forty by forty is 1,600 calls per reading. Weekly that is 83,200 calls a year on one assistant. Monthly it is 19,200.
What each design costs in calls, per reading and per year
| Design | Calls per reading | Weekly for a year | Monthly for a year | Source |
|---|---|---|---|---|
| 8 prompts, 1 repeat | 8 | 416 | 96 | derived |
| 12 prompts by 5 repeats | 60 | 3,120 | 720 | derived |
| 20 prompts by 20 repeats | 400 | 20,800 | 4,800 | derived |
| 40 prompts by 40 repeats | 1,600 | 83,200 | 19,200 | derived |
| 40 by 40 across two engines | 3,200 | 166,400 | 38,400 | derived |
as of 2026-09-02
Method: Multiplication from a stated design and nothing else, so every cell is checkable: prompts times repeats times engines for the first column, times 52 and times 12 for the other two. Converting calls into money depends on your provider and model and is deliberately not asserted here as a single figure. Falsify it by finding a provider whose per-call cost varies with the design, which would change the money column and not this one.
Two engines doubles all of it before anything else does, which is the argument for choosing one and sampling it properly rather than spreading thin. And notice what the table makes obvious: the honest design costs about twenty seven times the calls of the cheap one. That ratio is the actual reason the category settled where it did. It is not that nobody knows the arithmetic. It is that the arithmetic asks for a budget nobody had to approve as long as the cheap version produced a number that looked the same on a slide.
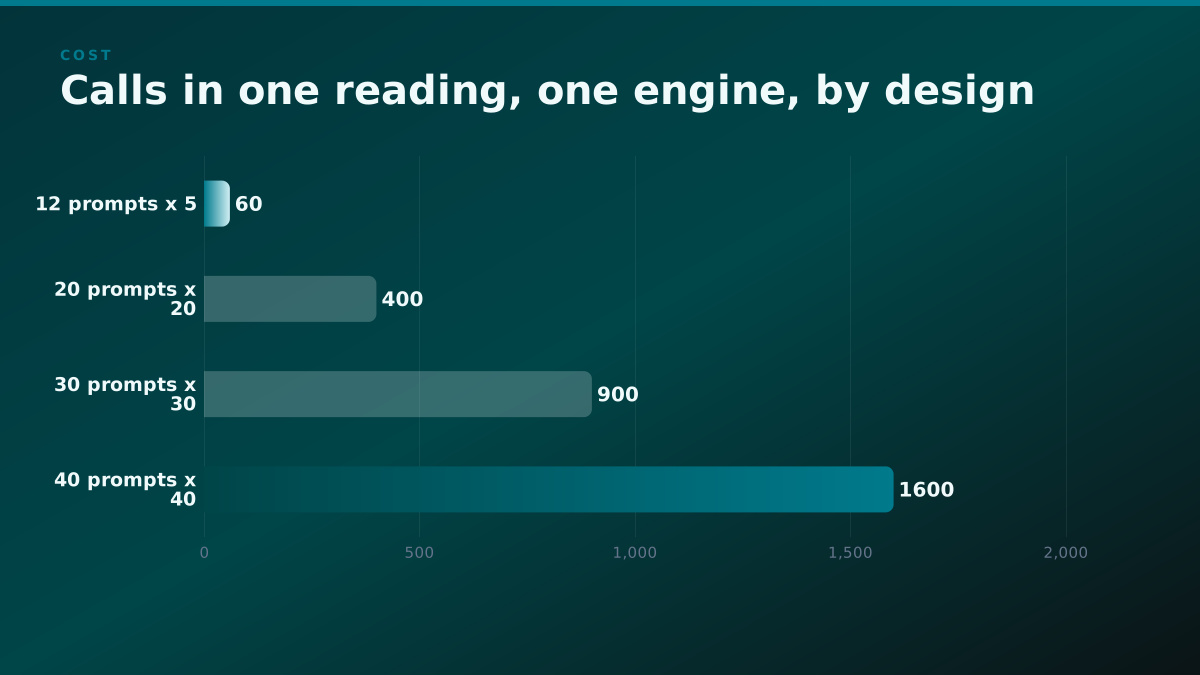
We are deliberately not converting calls into money here. Per-call pricing depends on your provider, your model and your contract, and it moves. What we will say is that the design most teams need is a low four-figure annual API bill on one assistant at monthly cadence, which is smaller than the tool subscription that is currently producing an unusable number, and that comparison is the one worth putting in front of whoever signs off the budget.
Sizing when you track more than one assistant
Everything above assumed one assistant. Most teams want four, so it is worth being explicit about what the second one does to the arithmetic, because it is not what people expect.
An assistant is not a dimension you can average over. Two assistants retrieve differently, cite differently, and disagree with each other on the same question. That is not a defect to be smoothed out, it is the most interesting thing in the data. A number blended across them has a spread that belongs to none of them, and when it moves you cannot say which surface moved, which is the only version of the answer that tells you what to do next.
So the correct structure is one complete experiment per assistant. Its own baseline, its own arms, its own null distribution, its own reading. Reported side by side, never merged.
That means the design multiplies. Forty prompts by forty repeats on one assistant is 1,600 calls per reading. On two it is 3,200, and every downstream figure doubles with it. The prompt set is shared, which is the one economy available, but nothing else is.
Which forces a decision most teams have never made explicitly. At a fixed budget you can have a well sampled reading of one assistant, or a badly sampled reading of four. There is no third option and the arithmetic will not be talked out of it. Four thin readings support no claim at all, and a claim about one surface is worth more than four numbers about nothing.
We would pick the assistant your buyers actually use, sample it properly, and say plainly in the report that the others were not measured. That last sentence is the part teams resist, and it is the part that makes the rest of the report trustworthy. A stated blind spot is a limitation. An unstated one is an error waiting to be found by somebody else.
There is one exception. If the purpose is the absence map rather than the comparison, spread as wide as you like. Coverage across four assistants at one repeat each is a perfectly good way to find out which questions produce answers you are missing from, on which surfaces. It is the third question from earlier, the causal one, that cannot be bought thin.
A note on model versions while we are here, because it interacts with sizing. If an assistant upgrades mid-window, the two halves of your window came from two instruments and the comparison across them is void regardless of how many prompts you had. No sample size defends against this. Record the model version string on every call, check it at the end of the window, and treat a change as a reason to re-baseline rather than as noise to absorb. The same applies when a provider changes its retrieval behaviour without changing a version string, which is harder to catch and is one reason we prefer a shorter window over a longer one.
The buyer questions themselves also differ by surface and by category, which is a set-construction problem rather than a sizing one, but it lands on the same design. What CLI and MCP buyers ask AI is not what an infrastructure buyer asks, and a set built for one and read on the other will look thin for reasons no repeat count can fix.
What to do when you cannot afford the design the arithmetic asks for
This will be a common outcome, so it deserves a real answer rather than a shrug. There are three honest moves and one dishonest one.
01 / Buy the design the effect requires
- Stands out
- The only option where a null result means something. Everything else in this post is a workaround for not having done this.
- Best for
- Teams whose measurement budget is a line item rather than a leftover, and who will be asked to defend a renewal with a number.
- Falls short
- It is expensive in calls and it is slow, because the honest version reads once at the end of a window rather than every Monday.
02 / Keep the small set and narrow the claim to match it
- Stands out
- Costs nothing and is completely defensible. A set of 12 prompts is a genuine absence map, and an absence map is a real deliverable.
- Best for
- Teams who need a content queue this quarter and are not yet being asked to prove that the work caused anything.
- Falls short
- You give up the causal claim entirely, and somebody will eventually ask for it. Saying no now is easier than retrofitting a control arm onto a set that has been drifting for two quarters.
03 / Keep the small set and raise the effect you are willing to call a result
- Stands out
- Honest, and occasionally correct. If the only decision you would change requires a very large move, then a design that only sees very large moves is the right size.
- Best for
- Teams at the start of a programme, where the realistic outcome is going from almost never cited to sometimes cited rather than a few points of improvement.
- Falls short
- It is very easy to talk yourself into this one afterwards. The effect size has to be written down before the baseline, or it becomes whatever the result happened to be.
The dishonest move, for completeness, is to run the small design, get a result that does not clear the bar, and report it as though the design could have seen something. That is expensive in both directions. A false negative cancels work that was working. A false positive renews work that was not.
There is a fourth option worth naming that is not on the list because it is not a sizing decision: change what you are measuring. Citation share across a prompt set is one observable among several, and it is a noisy one. If the question is whether a specific page is being retrieved and used, that is a narrower observation with much less variance and a correspondingly smaller sample requirement. Narrower questions are cheaper to answer, which is a general property of measurement and not a trick.
The failure modes, and where each one is caught
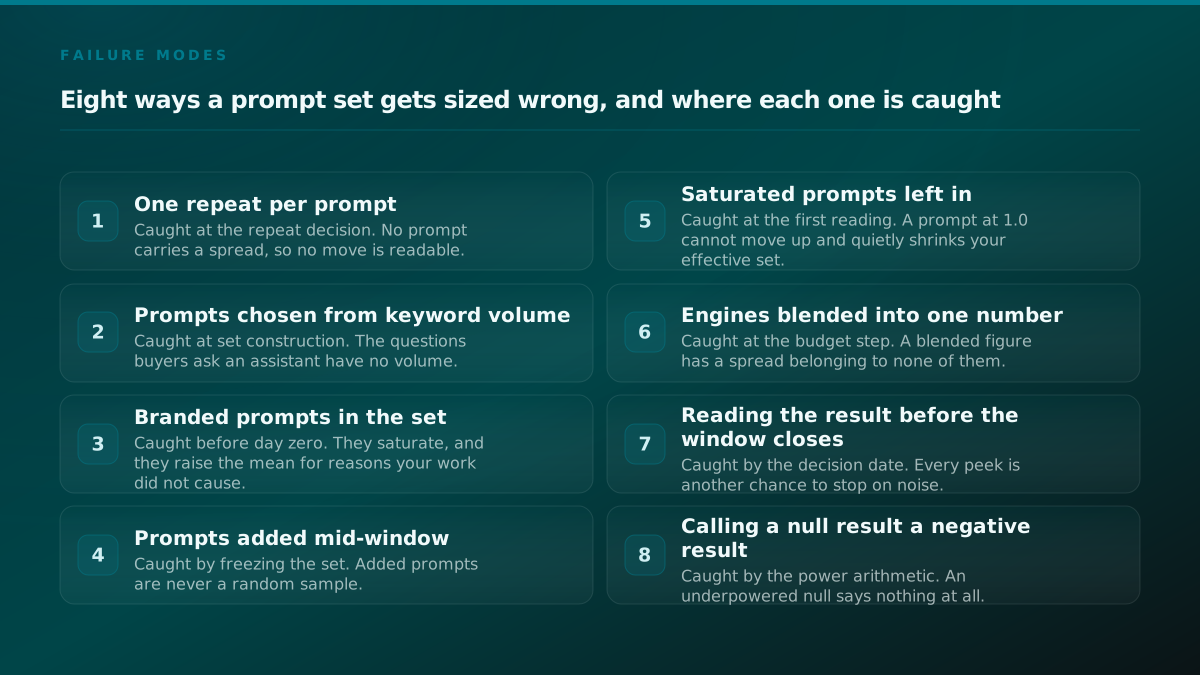
Every failure below is caught by a decision that takes minutes and has to happen before the first call rather than after the first reading. That timing is the whole point. None of these is expensive to prevent and all of them are unfixable afterwards.
Eight sizing failures, and the step that catches each one
| Failure | Caught at | Source |
|---|---|---|
| Taking a prompt count from a blog post instead of measuring instability | Step zero | derived |
| One repeat per prompt, so no prompt carries a spread | The repeat decision | derived |
| Choosing prompts by keyword volume | Set construction | derived |
| Leaving branded prompts in the set | The pre-day-zero sweep | derived |
| Adding prompts mid-window | The freeze | derived |
| Splitting a 12 prompt set into two arms of 6 | The arm split | derived |
| Reading the number every week and stopping on the first crossing | The decision date | derived |
| Reporting an underpowered null as a negative result | The power arithmetic | derived |
as of 2026-09-02
Method: Derived from the failures we have hit while building and running this instrument, each mapped to the step that would have caught it. It is a checklist rather than a frequency claim, and nothing here says how often each one occurs. Falsify the list by naming a ninth sizing failure that none of the eight steps would have stopped.
Three of them are worth a sentence each because they are the ones we see most.
Taking a prompt count from a post is first on the list because it is the one this whole article exists to stop. Every number in this post came out of our own instability rate, and yours will be different. If your prompts are more stable than ours, you need a smaller design than we do, and taking our number would waste money in the other direction.
Splitting a small set into two arms is second because it is the failure that hides inside a good decision. Somebody reads about held-out controls, correctly decides they need one, and applies it to twelve prompts. Now there are six per arm. The instinct was right and the set was too small for it, and the resulting comparison is worse than no comparison because it looks like rigour.
Reporting an underpowered null as a negative result is third because it costs the most. A design that cannot detect a ten point move returning no detectable move is not evidence about the work. It is evidence about the design. The output should be a resized design and a request for a bigger budget, not a recommendation to stop.
What none of this arithmetic tells you
Sizing settles one question and it is important not to let it stand in for the others.
It does not tell you whether the prompts are the right prompts. A perfectly sized experiment on forty questions your buyers never ask is a precise measurement of nothing. Prompt selection is a separate discipline and the pages ranking for this term are mostly about it, which is why Conductor's explainer on prompt tracking and its neighbours are worth reading alongside this one rather than instead of it.
It does not tell you whether the assistant is behaving the same way across the window. A silent model upgrade mid-window changes the instrument, and no sample size protects against that. The only defence is recording the model version string on every call and checking it at the end. That belongs in the record schema, which we wrote out in the procedure and proof runbook.
It does not tell you what a citation is worth. Every number in this post is about detecting a change in citation share. Whether a change in citation share is worth what it cost is a question about your funnel, and this instrument does not observe a single step of that path.
And it does not tell you that a single score is meaningful, which is the argument we made separately in why a single AI visibility score is noise. Sizing makes a comparison believable. It does not rescue a number that was never a comparison in the first place.
Scope
What sizing arithmetic settles, and what it leaves open
| A recommended prompt count | Sizing from your own instability | Still open after both | |
|---|---|---|---|
| How many prompts | A number somebody measured on a different set, if they measured at all. | A number derived from the smallest change you would act on. | Whether the prompts themselves are the ones your buyers ask. |
| How many repeats | Usually unstated. | Derived from the spread you want on each prompt. | Whether the model's behaviour is stable across the whole window. |
| Whether a move is real | No. A number that moved is not a result. | Yes, within one window, against a null you computed yourself. | Which specific change caused it, if you shipped several at once. |
| Whether it was worth the money | No. | Partly. It gives you a defensible numerator. | The revenue path, which none of this observes. |
From the field
Ten pages rank for this term and none of them states a number
We pulled the live top ten for the head term on 2026-09-02. Nine are editorial explainers of what prompt tracking is and how to choose prompts, and the tenth is product documentation for prompt versioning inside an observability tool, which is a different thing sharing the name. The page ranking tenth is literally titled around choosing prompts to track. Selection is covered ten times over. Sample size is covered zero times, which is why this post exists.
One further limit that applies to this post specifically. The term itself is not settled. Six of the ten pages currently ranking for it sell a tracking product, and one of them, Datadog's documentation on prompt tracking, is about prompt versioning inside an observability tool, which is a different activity that happens to share a name. If you arrived here looking for that, none of the arithmetic above applies to you.
A reference card, in digits
Everything above in the form you would actually keep on a page. Every figure here appears earlier with its derivation attached; this is the lookup, not the argument.
The step-zero probe. 12 prompts, 5 identical repeats, 1 model, 1 day, 60 calls. Ours returned 60 of 60 and flipped 7, an instability rate of 58.3 percent. Run it before choosing anything.
The repeat floor. At 5 repeats a prompt's hit rate has a standard error of 0.224 and exactly 6 possible values. At 10 it is 0.158 and 11 values. At 20 it is 0.112 and 21 values. At 40 it is 0.079 and 41 values. Below 5 there is no proportion at all.
The detection floors, computed from our own variance. 51.1 points at 12 by 5. 21.4 at 20 by 20. 11.4 at 30 by 30. 9.9 at 40 by 40. Pick the smallest design whose floor sits under the effect you named.
The call arithmetic, one assistant, one reading. 60 calls at 12 by 5. 400 at 20 by 20. 900 at 30 by 30. 1,600 at 40 by 40. Multiply by 52 for weekly and by 12 for monthly: 3,120 and 720 for the small design, 20,800 and 4,800 for the middle one, 83,200 and 19,200 for the large one. Two assistants doubles every figure, so 40 by 40 weekly across two is 166,400 calls a year.
The exchange rate. Going from 60 calls to 1,600 is 26.7 times the spend for 5.2 times the resolution, which is the square relationship and the reason there is no cheap way to buy detection.
The bar. Our own null across 20,000 label shuffles centred on zero with a standard deviation of 0.215, so a conventional 2 standard deviation threshold sits at about 0.43.
The peeking cost, at that threshold. About 5 percent false crossings at 1 look, 9.8 at 2, 18.5 at 4, and about 46 percent across 12 weekly looks in a quarter. Read once, at the end.
If you take one number away
Take your own instability rate.
Everything else in this post is downstream of it. Twelve prompts, five identical repeats, one model, one day, count the flips. It costs sixty calls and it replaces every recommended prompt count you will ever read, including the ones here, with a number measured on your own questions.
Then name the smallest change you would act on, before you look at any comparison. Read the floor off a power ladder computed from your own variance. If the smallest design that clears your named effect is affordable, buy it. If it is not, say so out loud and pick one of the two honest fallbacks, a narrower claim or a larger effect size, rather than running a design that cannot answer the question and reporting its output as though it could.
The reason none of the ten pages ranking for this term states a number is not that the number is secret. It is that stating one requires measuring your own variance first, and a recommendation that begins with "run this probe on your own set" is a worse blog post and a better answer. We would rather publish the arithmetic and the places our own design falls short of it than a prompt count we cannot defend, which is also the position we take across answer engine optimization generally and everywhere else in our measurement writing. This same arithmetic is the whole answer to how you prove an AEO engagement caused a citation lift rather than coincided with one.
Sources
Every number above, and where it came from. A figure without a row here is one we should not have printed.
- Our own step-zero repeat run
- 12 money queries, 5 identical repeats each, one model, one day, nothing changed between runs. 60 calls, 60 succeeded, 7 of the 12 changed outcome between identical asks. Every sizing figure in this post starts from that instability rate.
- Our own 20,000-split permutation test
- 20,000 random splits of the same query set with no intervention applied. The difference between halves centred on zero, mean plus or minus 0.0016, standard deviation 0.215. The spread is the bar a real result has to clear.
- Our own power analysis for the two-arm design
- Minimum detectable lift by design size: 51.1 percentage points at 12 prompts by 5 samples, 21.4 at 20 by 20, 11.4 at 30 by 30, 9.9 at 40 by 40. Computed from the variance in our own run rather than from a vendor table.
- Semrush, the product documentation for prompt tracking
- A knowledge-base article on what prompt tracking is and how to set prompts up. Cited here as evidence for what the category documents, which is selection and collection, and where it stops, which is before sample size.
- Moz, what prompt tracking is
- An editorial explainer covering the definition and the workflow. Read live on 2026-09-02 as part of the top-ten pull for the head term. It states no prompt count and no repeat count.
- Search Engine Ranking, how to choose prompts to track
- The clearest statement of what the category currently teaches, a selection method with no sizing arithmetic attached. Its own title is about choosing rather than counting.
- Conductor, an academy explainer on AI prompt tracking
- A teaching page covering what to track and why. Cited for the same reason as the two above, as a map of where the published material currently ends.
- Datadog, prompt tracking in LLM observability
- Product documentation for a different thing sharing the same phrase, prompt versioning inside an observability product. Included because it is live in the top ten and shows the term is not yet settled on one meaning.
- r/aeo, a practitioner measuring the volatility directly
- "We asked AI the same buying question 30 times in a row." 23 upvotes, 23 comments. The poster reports a different top brand 4 times out of 10 and the recommendation list overlapping about half the time between identical asks. Read live through the Reddit API while drafting this post.
- Rand Fishkin putting the repeat question directly
- 332 likes, 78 retweets, 46 replies, 72,506 views. Asks whether the same request for product recommendations returns the same list twice across 100 asks, and what that means for anyone tracking brand presence. Read live through the X API while drafting this post.
- A tutorial on finding a thousand prompts to track
- A walkthrough of building very large prompt sets for AI search engines. Cited as the opposite pole from the eight to twelve recommendation, and as evidence that the published material argues about selection breadth rather than about detection.
Questions people actually ask about sizing a prompt set
- How many prompts should I track?
- Size it from your own instability rate rather than from a recommended number. Ask a dozen prompts five identical times, count how many flip, then name the smallest change you would act on. Our published ladder puts the floor at 51.1 percentage points for 12 prompts by 5 repeats, and at 9.9 points for 40 by 40.
- How many times should I repeat each prompt?
- Enough that one prompt's hit rate is worth reading. At five repeats that rate carries a standard error of 0.224 and can only take six values at all, which is very coarse. Ten repeats halves the granularity and twenty gets the standard error to 0.112, and past forty the curve has flattened enough that prompts are the better spend.
- Is a set of 8 to 12 prompts enough?
- It is enough to find the questions you are absent from, and that is a real deliverable worth having. It is not enough to say a week-over-week change is real. A set that size sits at or below our 60-call anchor, whose smallest detectable change is 51.1 percentage points, far larger than any normal programme result.
- Why does my prompt tracking number move when I changed nothing?
- Because assistant answers are not stable between identical asks. In our own run, 12 prompts asked five times each on one model in one day produced 7 that changed outcome with nothing altered between runs, which is 58.3 percent. A single reading is one draw from a distribution, so movement between two readings is mostly that distribution's width.
- Should I add more prompts or more repeats?
- They buy different things and are not interchangeable. Repeats tighten one prompt's own hit rate and never reach the comparison. Prompts tighten the comparison between a worked group and a held back group, which is what a spending decision rests on. If the goal is proving your work moved something, add prompts first.
- How often should I re-run the prompt set?
- Less often than you want to. Extra readings add no detection power and every look is another chance to cross a threshold on noise. At a two standard deviation bar, one look carries about a 5 percent false crossing rate, four looks about 18.5 percent, and weekly reading for a quarter about 46 percent.
- Can I add prompts to the set partway through?
- Not without ending the comparison. Added prompts are never a random sample, since the ones people remember are the ones a brand already wins, so the denominator changes in a direction that inflates the result. Freeze the set at day zero and treat any change as the start of a new window with its own baseline.
- What if I cannot afford the design the arithmetic asks for?
- Then say the design is underpowered rather than reporting its null as a negative result, which is the expensive mistake. You have two honest options. Narrow the claim to absence mapping, which a small set does well. Or raise the effect size you would call a result, written down before the baseline rather than after.
Keep reading
Measurement
How to Track AI Visibility, and How to Read What It Tells You
The trackers solved collection and left interpretation alone. The record schema, the sampling trade, the null distribution, and whether your design could see a win.
41 min read
Measurement
Why a single AI visibility score is noise
Twelve money queries, five identical repeats, one model, one day. Seven changed their answer, which breaks every before-and-after published in this category.
24 min read
Measurement
AirOps Alternatives: Content-AEO vs Pure Measurement
Nine real AirOps alternatives, split into content production and pure measurement, plus the buyer split most vendor comparison pages miss entirely.
25 min read