How AI Share of Voice Is Calculated: Five Cases That Disagree
AI share of voice is one simple formula, yet the same AI answers produce very different numbers. Five real cases show where the denominator decides the result.
Citon12 min read
Short answer
How is AI share of voice calculated?
AI share of voice is your brand mentions divided by all brand mentions across a set of prompts sent to AI answer engines, expressed as a percentage. The formula is trivial. The number is not, because almost every disagreement between two dashboards comes from the denominator, not the counting. Who is in the competitor set, whether non-brand entities are filtered out, how each prompt is weighted, and how many times a prompt is repeated all move the result while your real visibility sits still. We walk five cases where the same answers give different numbers, each with its figure and its source, and show what to report instead.
Type a share-of-voice number into a leadership deck and it reads as a fact. It is 42 percent, it was 38 percent last quarter, the line is going up. The trouble is that the same set of AI answers, counted by two honest tools, can produce two numbers that are far apart, and the gap almost never comes from the counting.
AI share of voice is a division. It is your brand mentions over all brand mentions across a set of prompts sent to AI answer engines, written as a percentage. That part is settled. What is not settled is the denominator: which brands are in the set, whether non-brand entities get filtered out, how each prompt is weighted, and how many times each prompt is run. Move any one of those and the number moves while your real visibility sits exactly where it was.
This post walks five cases where the same answers give different numbers. Each one carries its figure and its source, and each one is a denominator or a sampling decision rather than a mistake in the arithmetic.
The short version
AI share of voice is your brand mentions over all brand mentions across a set of prompts, as a percentage. The formula is trivial, so the denominator decides the number. Five real cases show the same answers giving different results: an undefined competitor set reads 100%, non-brand entities inflate the list, a weighting base moves on its own, branded prompts floor the score, and identical repeats disagree. Report the denominator, not just the percentage.
At a glance
Five places the same AI answers give different share-of-voice numbers
| The case | What moves the number | The figure |
|---|---|---|
| An undefined competitor set | The denominator has nothing in it but you | A reported 100% share |
| Non-brand entities in the list | Caffeine and a regulator counted as competitors | A brand at 9.5% beside 4.6% and 2.5% |
| A volume-weighted denominator | The weighting base changed, not your visibility | A new base from 2026-08-31 |
| Branded prompts in the set | The model repeats a name you handed it | One site moved from 47 to 13 |
| Identical repeats disagree | Model output is not deterministic | 7 of 12 queries flipped across 5 repeats |
The formula, and why it is not the hard part
AI share of voice is the count of answers that mention your brand divided by the count of all brand mentions in the same set of answers, turned into a percentage. If a competitor set of ten brands is named across a hundred answers and you appear in thirty of those mentions, your share is thirty percent. Nothing about that is hard.
The hard part is every decision that happens before the division. A share is a fraction, and the argument is always about the bottom of the fraction, not the top. The five cases below are five different ways the bottom of the fraction gets built, and each one produces a number a reader will assume means market position when it means something narrower.
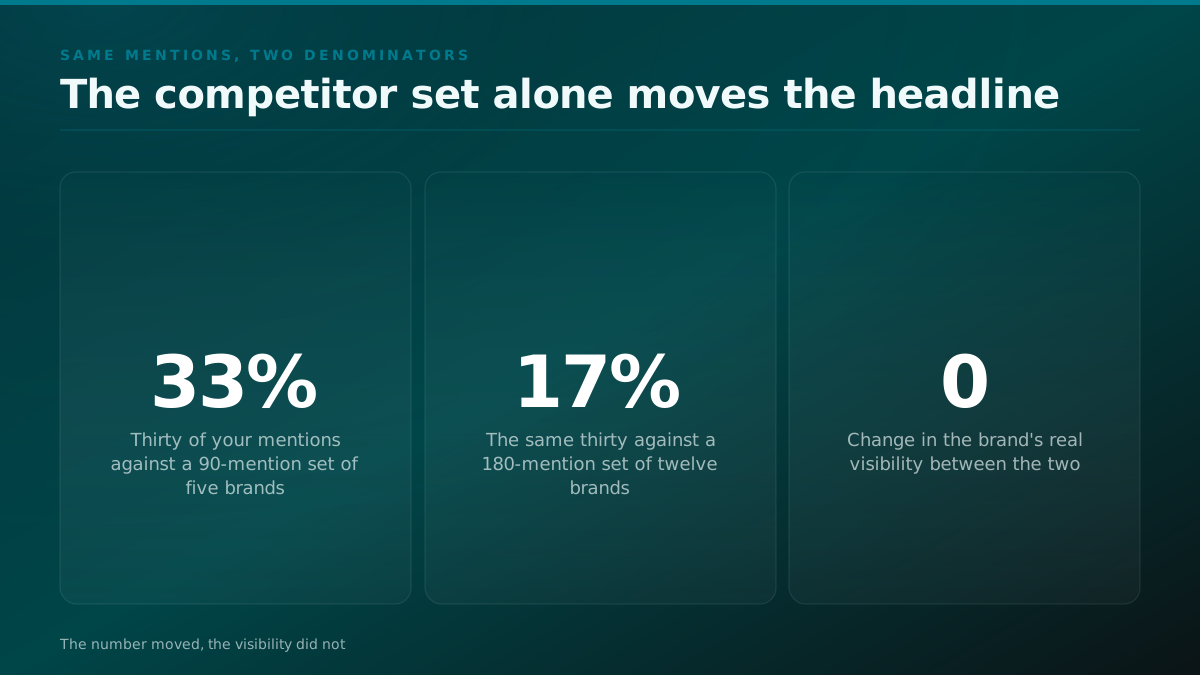
Run the same thirty mentions through two defensible denominators and watch the headline move. Count your thirty mentions against a competitor set of five brands that together collected ninety mentions, and your share is 33 percent. Count the identical thirty against a broader set of twelve brands that collected one hundred and eighty mentions, and the same visibility reads as 17 percent. Nothing about the brand changed between those two numbers. One analyst drew a tighter competitor set than the other, and the fraction did the rest. That is the whole problem in one calculation: a share number carries a hidden argument about who counts, and the percentage on top never shows it.
Share of voice is a division. The argument is never the top of the fraction, it is the bottom, and most dashboards never show you what they put there.
From the field
The formula is settled, the denominator is not
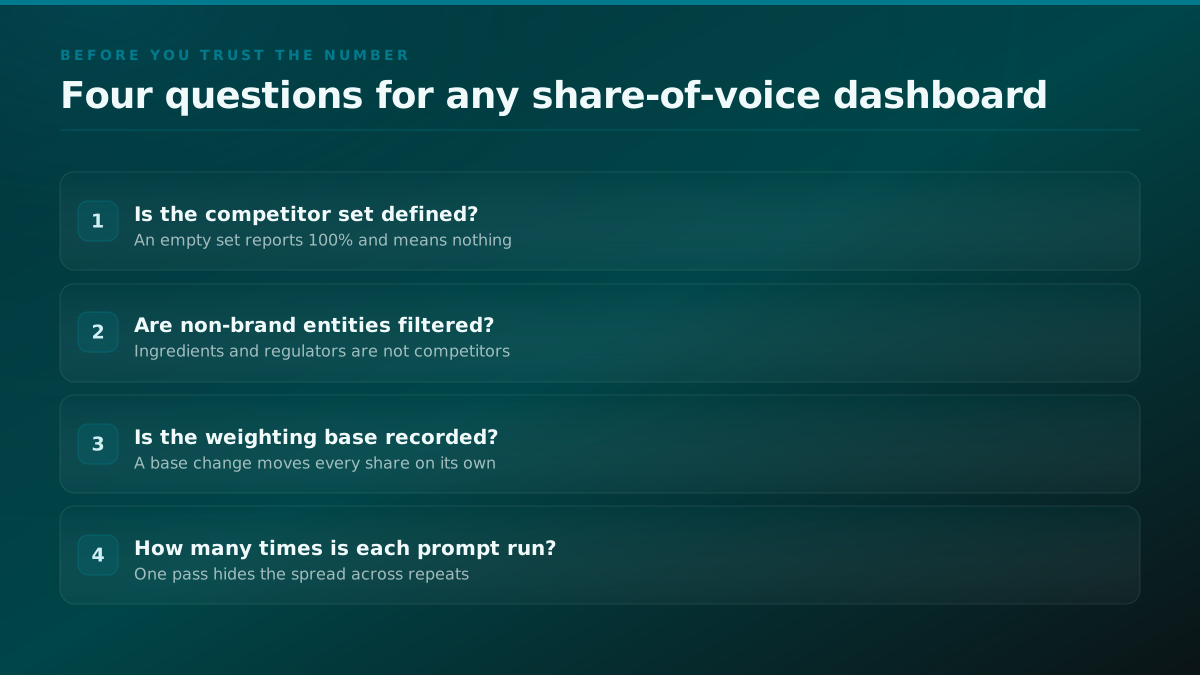
Every AI share of voice number is one brand's mentions over all mentions in some set. The division is not where tools disagree. They disagree on what goes in the set, whether non-brand entities are removed, how each prompt is weighted, and how many times a prompt is run. Two dashboards reading the same answers can print numbers that are far apart and both be arithmetically correct, which is why a share number with no stated denominator is not yet a measurement.
Across the five cases in this post
- An undefined competitor set reports 100%
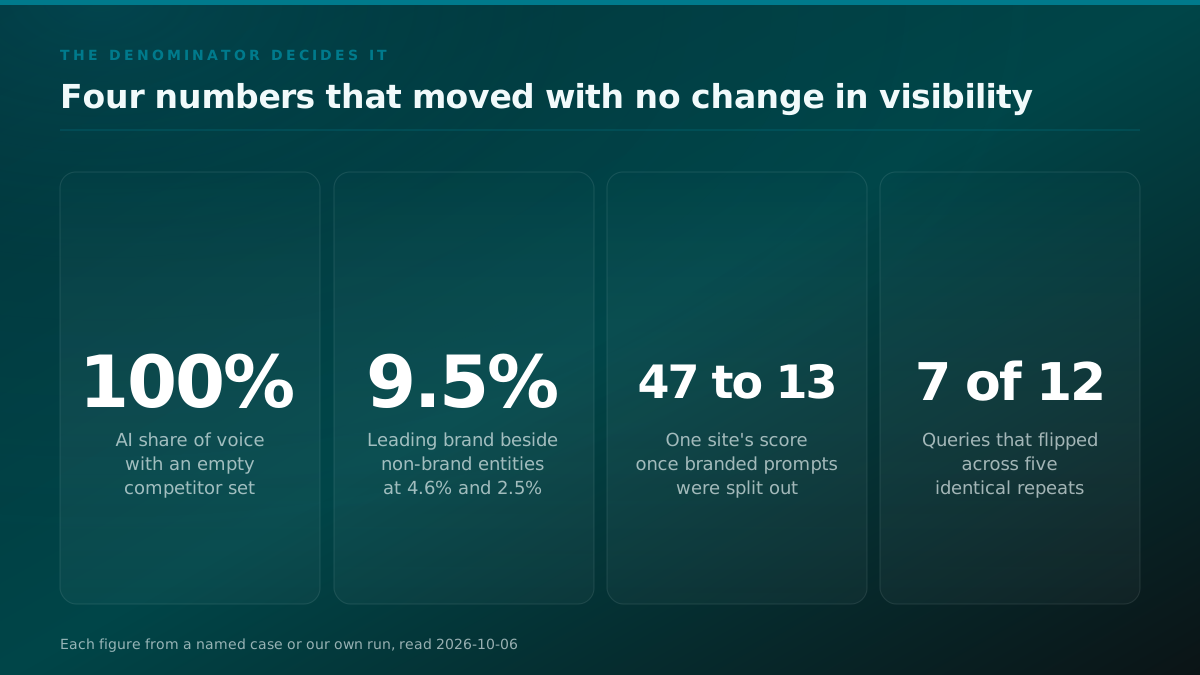
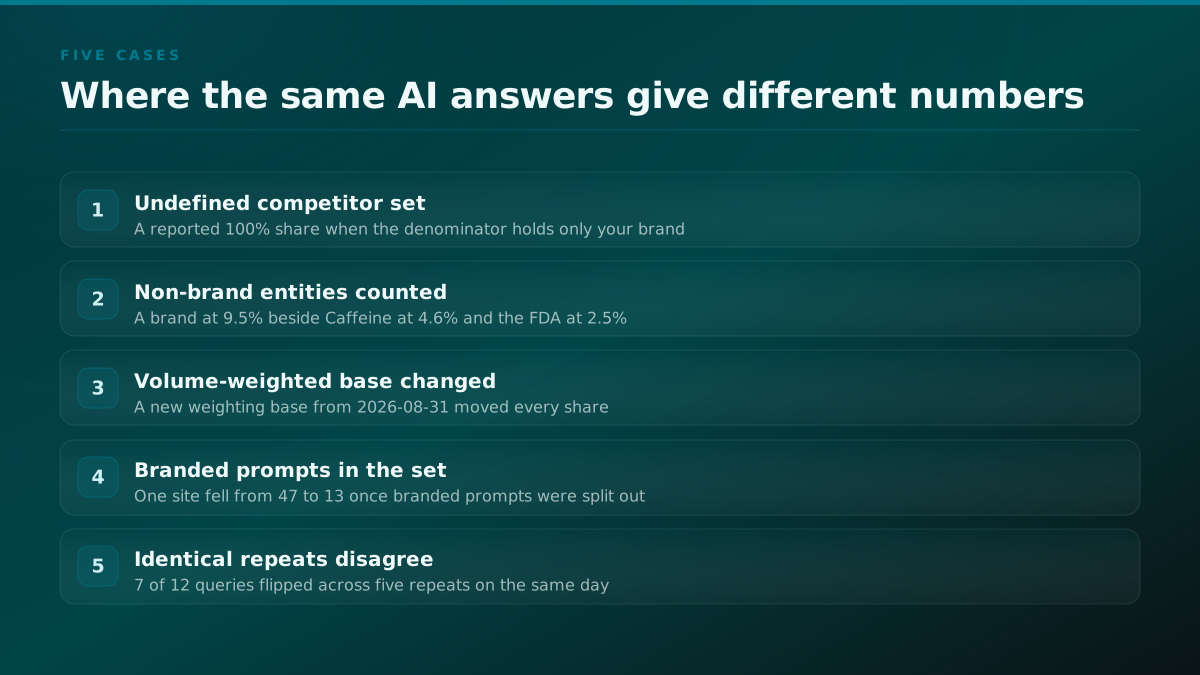
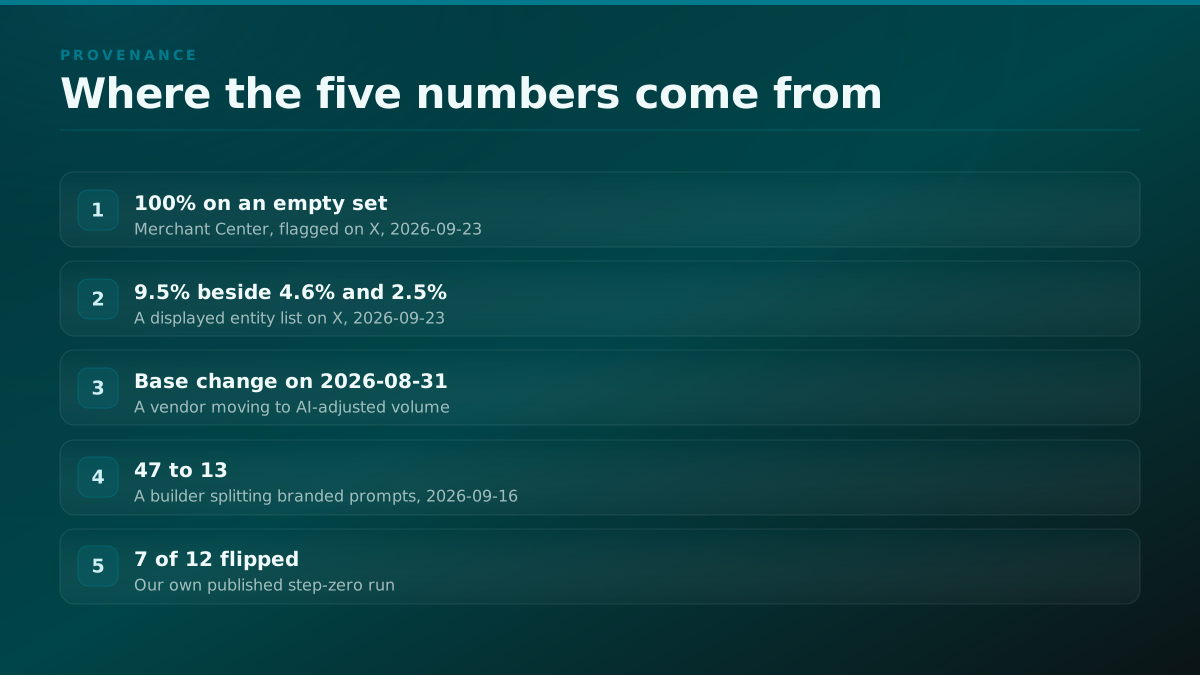
The cleanest way to read a perfect score is to divide by almost nothing. A brand monitoring dashboard can report a 100% AI share of voice when an empty competitor set is defined, because the denominator holds nothing but the brand itself. Google's own Merchant Center documentation describes the behaviour, and a practitioner flagged it plainly: a 100% reading is not proof of market dominance, it is proof that nobody else was in the set.
The figure to watch here is the one that looks best. A share of an empty market is arithmetically real and analytically worthless. Before a share number means anything, the competitor set has to exist and has to be named beside the result, so a reader can see what the brand was measured against.
This case is common precisely because the default is friendly. A fresh dashboard with an empty competitor list does not refuse to compute a share. It computes the one it can, which is your mentions over your mentions, and prints 100%. The number then travels into a weekly report, and the first competitor a buyer adds the following month drops it to something ordinary, which reads as a decline that never happened. The honest version of the 100% case is not a number at all. It is a note that says the competitor set was empty, so there is nothing to divide against yet.
A share report that looks clean and is not
AI share of voice: 100%
100%
Reported share of voice
0
Competitors in the set
No
Non-brand entities filtered
1
Repeats per prompt
- The competitor set is empty, so the denominator holds only your brand
- Entities are unfiltered, so an ingredient or a regulator would count
- Each prompt runs once, so the spread across repeats is invisible
- No read date on the weighting base, so a base change reads as a swing
- Non-brand entities inflate the denominator
The next case is subtler, because the denominator is not empty, it is contaminated. A displayed share-of-voice list for a crowded category put the leading brand at 9.5%, then listed Caffeine at 4.6% and the FDA at 2.5% in the same ranking. Caffeine is an ingredient and the FDA is a regulator. Neither is a competitor, and both are sitting in the denominator the leading brand is being divided against.
Every non-brand entity left in the list drags the real brand shares down, because the fraction is being divided by a larger bottom than the market actually contains. Filter the list down to brands and every genuine share rises. The fix is a cleaning step before the count, and the cost of skipping it is a number that looks more competitive than it is.
Entity contamination is harder to catch than an empty set, because the number looks plausible. Nobody questions a 9.5% share the way they question a 100% one. It takes reading the full list to notice that two of the three names beside the leader are an ingredient and a regulator, and most reports never show the full list, only the leader's figure. The reason the contamination happens at all is that the extraction step, which pulls named things out of an answer, does its job well and pulls out everything named: brands, ingredients, agencies, standards bodies. Turning that raw entity list into a competitor set is a separate decision, and a tool that skips it is not wrong about what it found, only about what it called a competitor.
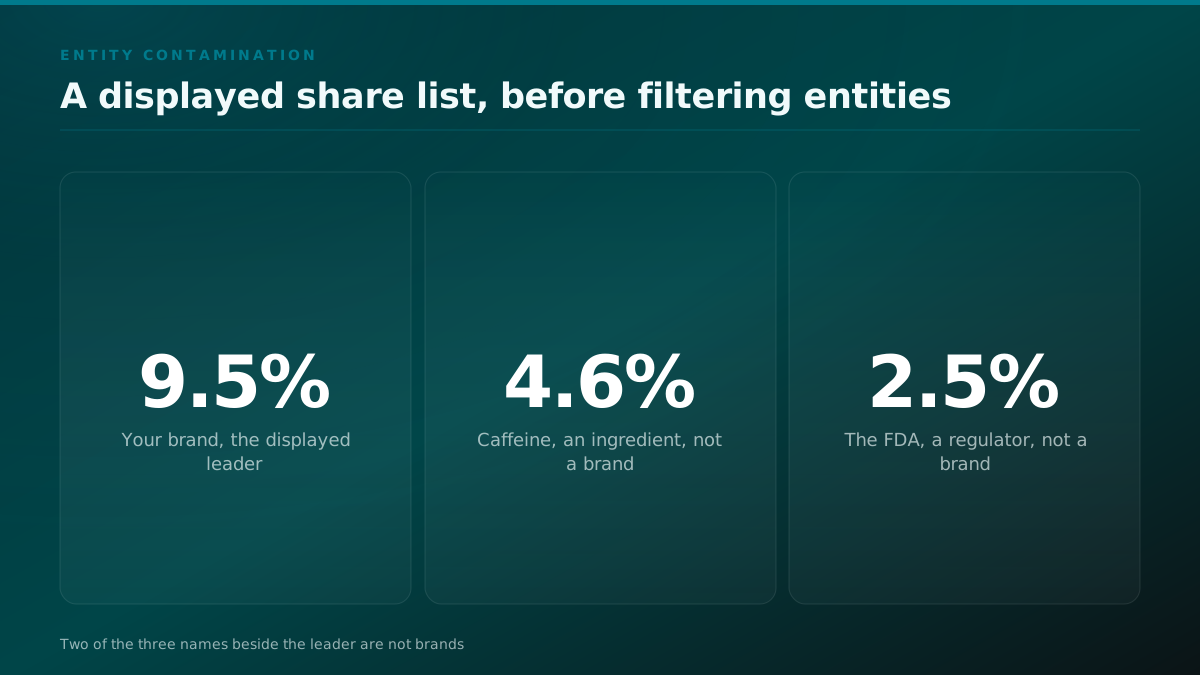
Entity contamination
A displayed share list, before filtering entities
| Point | Value (%) |
|---|---|
| Your brand | 9.5 % |
| Caffeine (an ingredient) | 4.6 % |
| FDA (a regulator) | 2.5 % |
- A volume-weighted denominator moves on its own
The third case moves the number with no change to the answers at all. On 2026-08-31 a widely used tool switched its AI share of voice from plain Google search volume to an AI-adjusted volume base, so a prompt's weight in the denominator changed overnight. The vendor said it directly: some prompts look bigger, some smaller, the gaps between you and the brands you track have shifted, and nothing about your real visibility changed. The denominator did.
A weighting base is a design choice, and when it changes it drags every share with it. The published methodology for AI-adjusted volume and the calculation walkthrough are worth reading before comparing a number from after the switch to one from before it. Record the base and its date next to any share you report, or a base change six weeks from now reads as a visibility swing that never happened.
Weighting is reasonable in principle. A prompt that millions of people ask should count for more than one almost nobody asks, and adjusting for how much each engine is actually used relative to Google is a defensible attempt at that. The hazard is not the weighting, it is the silent re-baseline. A prompt's number on one engine and its number on another are no longer the same number after the switch, so a chart that spans the change date shows a step that belongs to the method, not to the brand. A brand sitting at 30% of the denominator before the switch can read 24% after it with no change in its own visibility, because the base under the fraction moved. The only defence is to timestamp the base, because a reader six weeks later has no way to separate a real move from a definitional one unless the report tells them a definition changed.
- Branded prompts floor the score
The fourth case is a sampling decision wearing a visibility number. A builder tracking AI visibility noticed that four engines returned the same score, run after run, within a point of each other. The number never moved. The cause was in the prompt set: the prompts contained the brand name, so the model was handed the answer and repeated it. A metric built on prompts that name the brand has a floor and a ceiling at the same place, and it cannot move regardless of what the brand does.
When the team split the prompts, keeping some branded and moving the rest to unbranded category queries, one site dropped from 47 to 13, a fall of 34 points on the same scale. The 13 is the honest figure, because it measures whether the brand surfaces on questions that do not already contain its name. A share number built on branded prompts is measuring an echo.
The distinction matters because the two question types answer different things. A branded prompt, such as asking an engine what it knows about a named product, tests whether the model can describe you correctly once it has been pointed at you. An unbranded prompt, such as asking for the best option in a category, tests whether the model reaches for you unprompted, which is the thing a buyer's own question actually looks like. Both are worth tracking, but folding them into one share hides the one that is hard to move behind the one that is nearly guaranteed. Reported separately, a high branded score and a low unbranded score tell a clear story. Blended, they tell a flattering one.
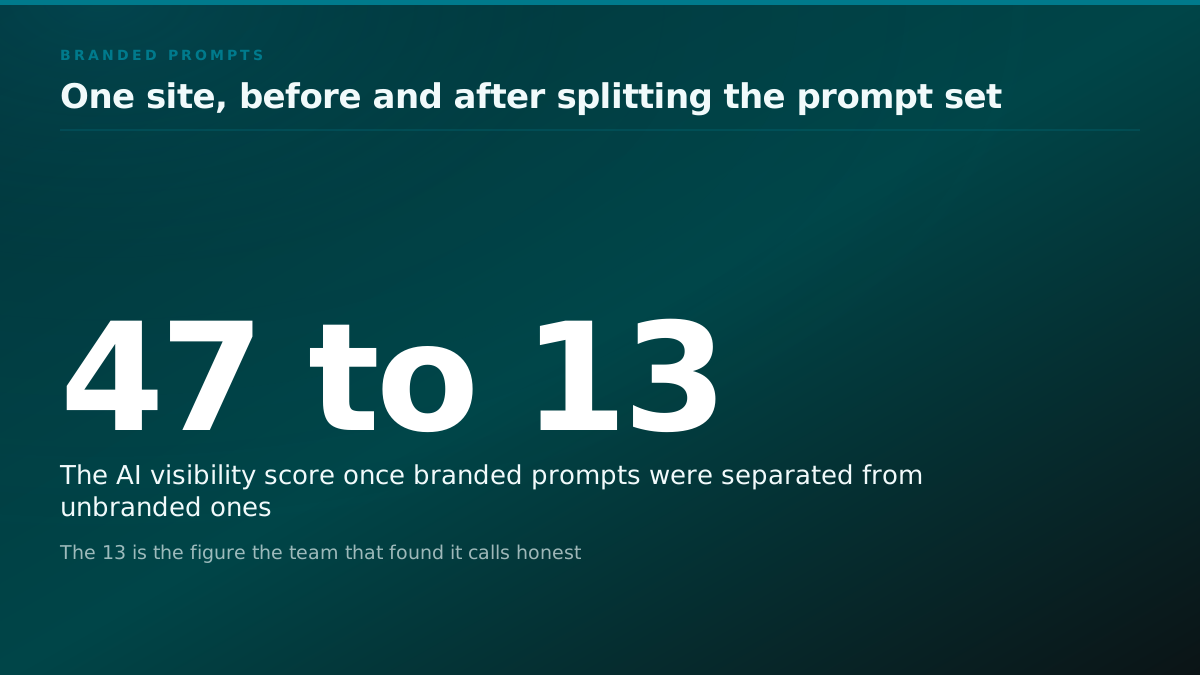
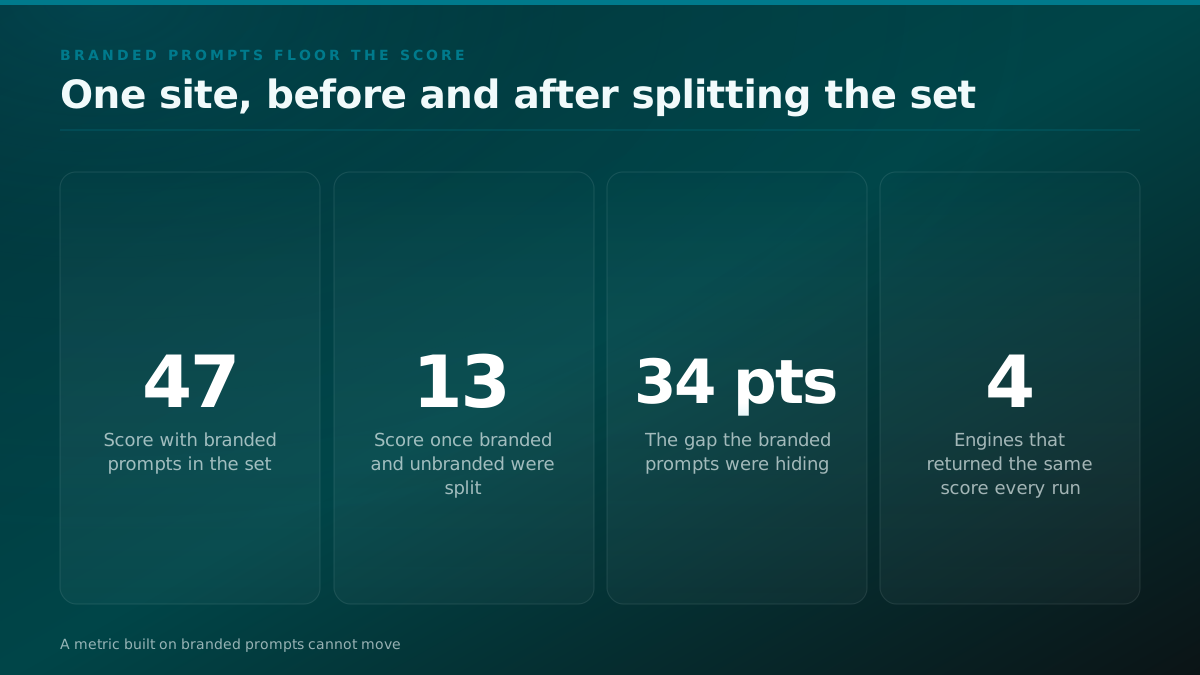
A number that cannot go down is not a measurement. It is a label that happens to be a percentage.
- Identical repeats disagree
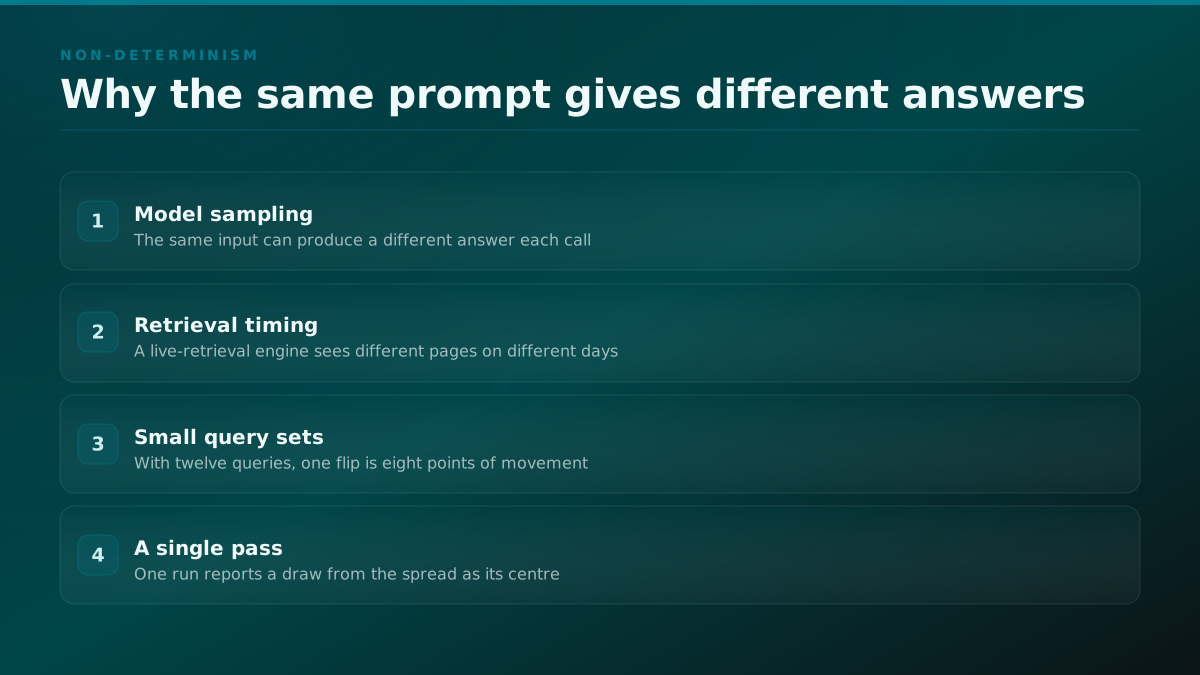
The last case is the one every single-pass score sits on without showing it. AI answers are not deterministic, so the same prompt can return a different answer on the next run. We measured this directly. Our own step-zero run sent 12 money queries five times each against one model on one day. 60 of 60 calls succeeded, and 7 of the 12 queries flipped which brand was cited across repeats that were identical by construction.
A separate permutation test ran 20,000 random splits of that same query set with no change applied at all, and the null difference centred on zero at a standard deviation of 0.215. The full method and the raw numbers are published in why a single AI visibility score is noise. A score that runs each prompt once reports a single draw from that spread as if it were the centre of it, which is how two honest runs of the same prompt set produce two different shares.
The practical reading of a 0.215 standard deviation is that two measurements taken minutes apart, with nothing changed, can sit most of a fifth of the scale apart purely from the model answering differently. With twelve queries, a single query flipping is more than eight points of movement, so a week-over-week change smaller than the spread is indistinguishable from the engine having a different afternoon. The fix is not exotic. Run each prompt several times, report the average and the spread together, and treat any movement inside the spread as noise until more passes say otherwise. A number with no spread beside it is hiding exactly the quantity that tells a reader whether to believe the trend.
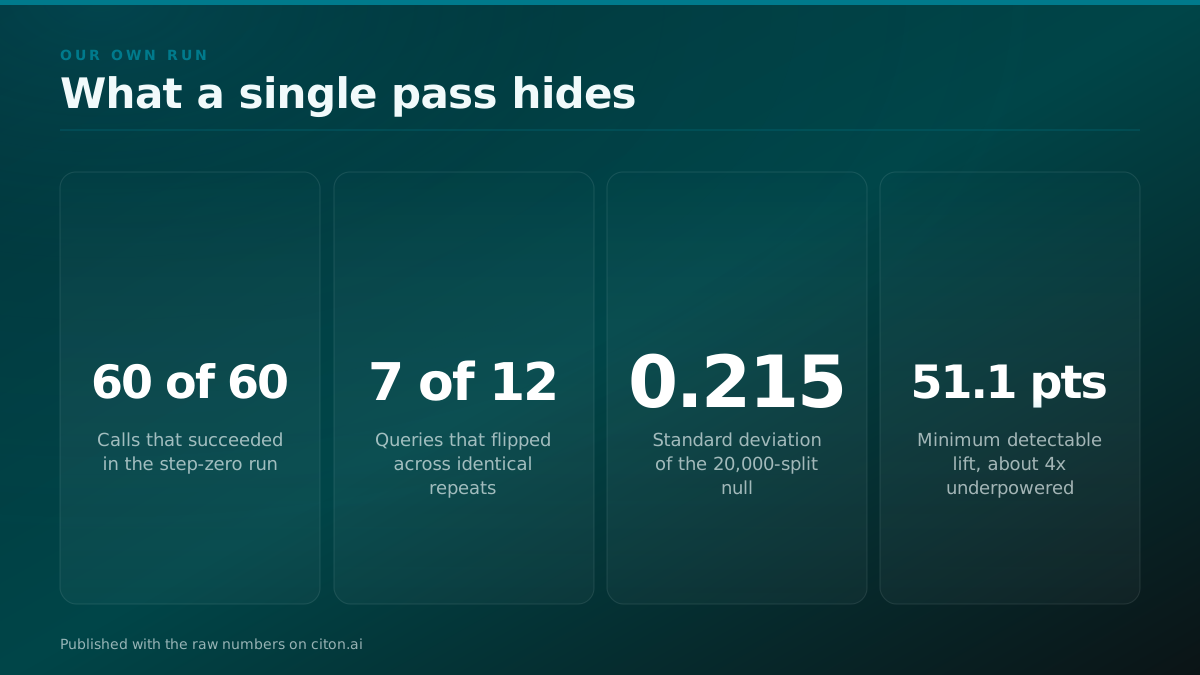
Worth knowing
A single pass hides a spread you can measure
Our own step-zero run sent 12 money queries five times each against one model on one day. 60 of 60 calls succeeded, and 7 of the 12 queries flipped which brand was cited across repeats that were identical by construction. A separate 20,000-split permutation test with no change applied produced a null centred on zero at a standard deviation of 0.215. A score that runs each prompt once is one draw from that spread, reported as if it were the centre.
What to report instead
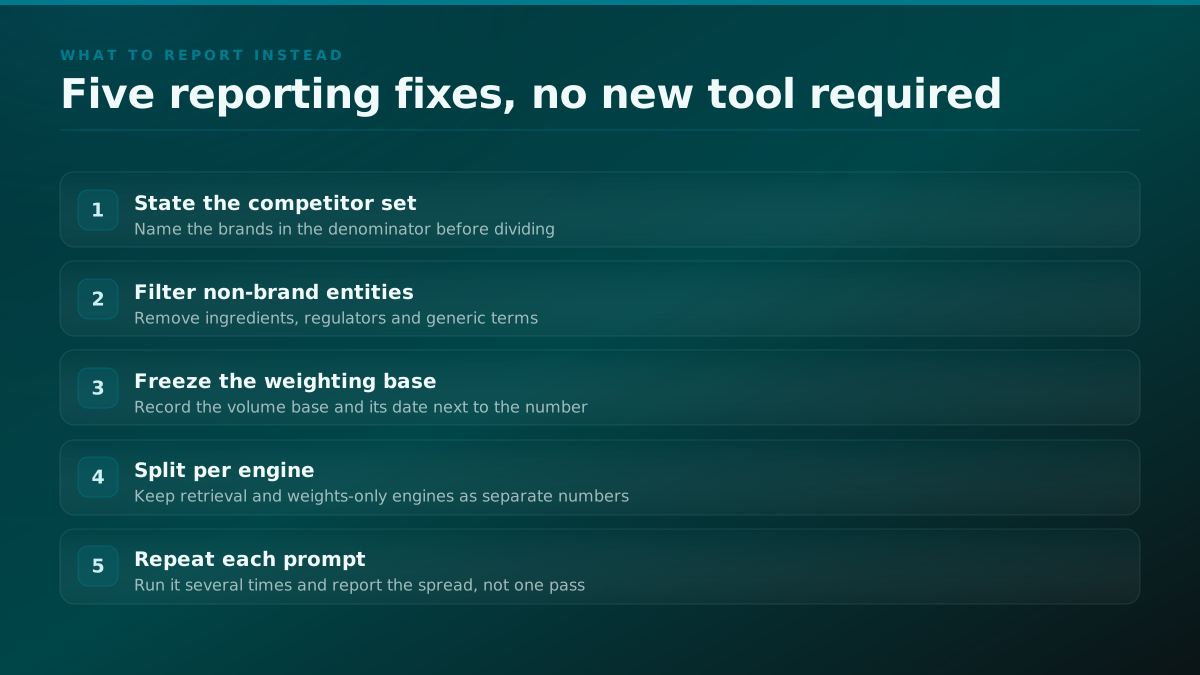
None of the five fixes needs a new tool. They are reporting choices, available in any dashboard that shows its working, and together they turn a share number into something a reader can act on rather than a figure that quietly depends on four decisions nobody wrote down.
What to report instead of a single share number
| Instead of | Report | Because | Source |
|---|---|---|---|
| One blended percentage | A per-engine breakdown | A retrieval engine and a weights-only engine move on different clocks | derived |
| A score with an empty competitor set | The named competitor set beside the number | 100% with nothing in the denominator is not dominance | published |
| A single pass per prompt | A repeat count and the spread across repeats | 7 of 12 of our queries flipped across identical repeats | measured |
| A raw entity list | A brands-only list with entities filtered out | Caffeine and a regulator are not competitors | published |
STEPS
How to report a share number a reader can trust
State the competitor set
First
Write down which brands are in the denominator before you divide. A number computed against an empty or undefined set is the 100% case, and it means nothing about the market.
Filter non-brand entities
Second
Remove ingredients, regulators and generic terms from the list before counting, or a brand reads as a larger share of a denominator stuffed with things no one competes with.
Freeze the weighting base
Third
Record the volume base and its date, so a change in the base is not read later as a change in visibility. A denominator that moves on its own moves every share with it.
Repeat and split
Fourth
Run each prompt more than once, report the spread, and keep per-engine numbers separate, because a retrieval engine and a weights-only engine do not move together.
State the competitor set, filter the non-brand entities, freeze the weighting base and its date, and repeat each prompt while keeping the engines separate. For the deeper version of this, our measurement procedure writes up how we baseline and re-measure, and the best AI visibility tools comparison covers which tools expose the denominator at all.
Five cases where the same answers are counted differently
| Case | The figure in the case | Where the number comes from | Source |
|---|---|---|---|
| Undefined competitor set | 100% share reported | Merchant Center with an empty competitor set | published |
| Non-brand entities counted | 9.5% beside 4.6% and 2.5% | A displayed list mixing brands and entities | published |
| Volume-weighted denominator changed | New base as of 2026-08-31 | A vendor switching to AI-adjusted volume | published |
| Branded prompts in the set | 47 dropped to 13 | Splitting branded from unbranded prompts | published |
| Identical repeats disagree | 7 of 12 queries flipped | Our own 12-query, 5-repeat step-zero run | measured |
n = 5 · as of 2026-10-06
Method: Rows 1 to 4 are published: each figure is read from a named public case cited in the matching section, recorded as reported rather than re-derived by us. Row 5 is measured: it is our own step-zero run of 12 money queries times 5 identical repeats against one model on one day, 60 of 60 calls successful, published with the raw numbers. The read date for every row is 2026-10-06. Limitation: these are specific cases, not an average over tools, and none proves how often each failure occurs across the market.
Three ways to get the number, and what each can answer
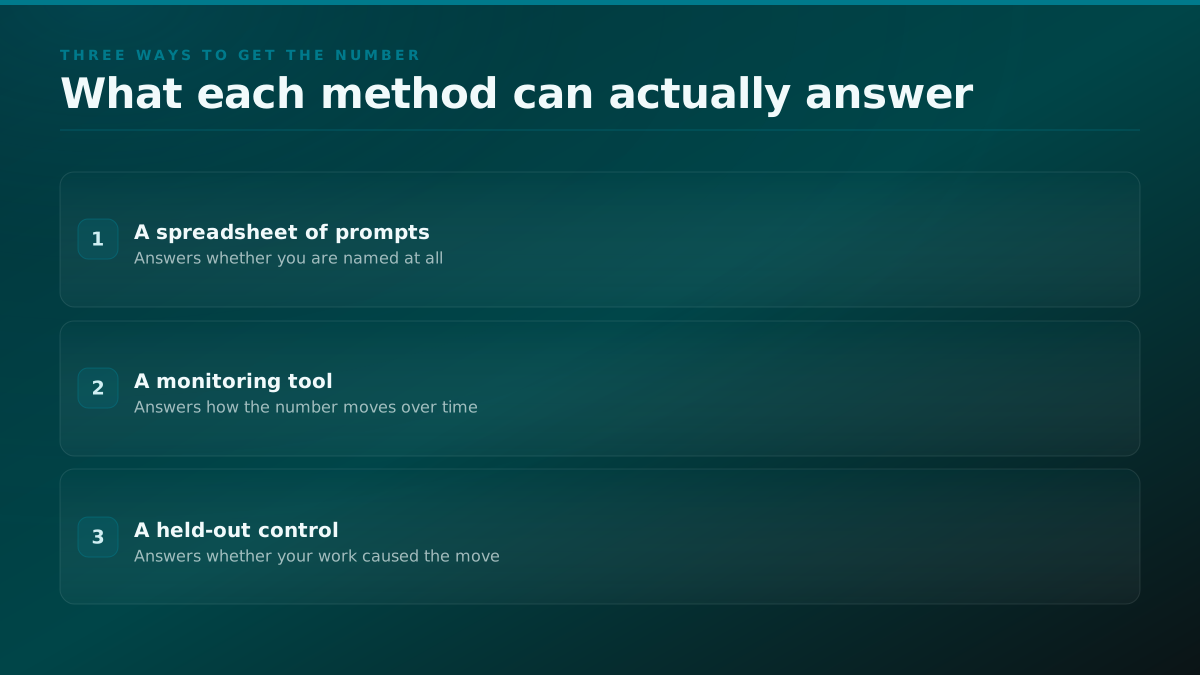
A share number is only as good as the method behind it, and there are three honest ways to produce one. A spreadsheet answers whether you appear at all. A monitoring tool answers how the number moves. Only a held-out control answers whether your work caused the move, because it keeps a set of queries deliberately unworked as a comparison.
01 / A spreadsheet of prompts
- Stands out
- Costs nothing but your time and answers one honest question, are we named at all, across a set of prompts you control and can read in full.
- Best for
- A team checking whether it appears in AI answers before spending on anything larger.
- Falls short
- One pass per prompt, so it cannot see the spread that our run measured at 7 of 12 queries flipping, and it has an empty competitor set unless you build one by hand.
02 / A monitoring tool
- Stands out
- Runs the prompts for you on a schedule and reports a trend, which is the right tool when the question is how the number moves week to week.
- Best for
- A team that already knows it wants a tracked number to report upward on a cadence.
- Falls short
- It still reports a score, not a cause, and most tools do not show the denominator, the entity filter or the repeat count that decide what the score actually measures.
03 / A held-out control
- Stands out
- The only one of the three where a change in the number is interpretable, because a set of queries is deliberately left unworked over the same period as a comparison.
- Best for
- A team spending enough on AEO work that the question did this work cause the change needs a defensible answer rather than a believable one.
- Falls short
- It costs more and takes longer than reading a dashboard, because a real control has to run before it produces a number worth trusting.
Three ways to get the number
What a spreadsheet, a tool, and a control each answer
| Spreadsheet of prompts | Monitoring tool | Held-out control | |
|---|---|---|---|
| Question it answers | Are we named at all | How the number moves over time | Did our work cause the move |
| What it costs | Your time, one pass per prompt | A monthly subscription | A query set left deliberately unworked |
| Failure mode | An empty set unless you build one by hand | A score with no cause behind it | Slower before a number is trustworthy |
That last rung is where answer engine optimization run against a control earns its cost. If you want the denominator behind your current number checked, or a control run against it, talk to us. It is the one question a dashboard cannot answer about its own score.
Methodology: how we counted these five
Every figure in this post is either read from a named public case or measured by us, and the read date for all of them is 2026-10-06. The 100% reading, the 9.5% list, the 2026-08-31 base change and the move from 47 to 13 are published cases, each linked in its own section (the 100% case cites Google's Merchant Center documentation) and recorded as reported rather than re-derived by us. The repeat-variance figures, 60 of 60 calls, 7 of 12 queries flipping, and the 0.215 null standard deviation, are our own and published with their raw numbers.
The ranking in this post is by how early each decision enters the pipeline, from building the set down to sampling it, not by how often each failure occurs. That is the main limitation: these are specific, dated cases, and the post does not measure how common each one is across the market, nor does any figure here describe a lift caused by any work. Our own design is underpowered by its own power analysis, with a minimum detectable lift of 51.1 points, so it supports a claim about noise and a claim about the null, and nothing about causation.
Citon publishes its measurement runs, including the parts where the instrument is still too blunt to prove what a buyer would want it to prove. A share-of-voice number is cheap to produce and easy to misread, and the five cases above are the ones that turn a reassuring percentage into a figure that cannot survive the question a careful reader will ask: what, exactly, is in the denominator.
Sources
Every number above, and where it came from. A figure without a row here is one we should not have printed.
- Merchant Center can report 100% share with no defined competitor set
- A practitioner post showing an AI share of voice reading of 100% when an empty competitor set is defined, with a link to the Google Merchant Center documentation, 17 views, posted 2026-09-23. Quoted as somebody describing a real dashboard behaviour, not as a measurement of anything.
- A displayed share-of-voice list mixing brands with non-brand entities
- A worked example where the leading brand shows 9.5% beside Caffeine at 4.6% and the FDA at 2.5%, posted 2026-09-23, 195 views. Evidence that an entity list counts non-brands in the denominator unless they are filtered first.
- Ahrefs moved Brand Radar impressions and AI share of voice to AI-adjusted volume
- The vendor announcing, on 2026-09-09, that as of 2026-08-31 its AI share of voice runs on AI-adjusted volume rather than Google search volume, so a prompt's number changed with no change in anyone's real visibility. Full methodology linked from the post.
- Branded prompts floored a visibility score at a fixed value
- A builder reporting that prompts containing the brand name returned the same score across four engines every run, and that splitting branded from unbranded prompts dropped one site from 47 to 13, posted 2026-09-16, 6 comments. The 13 is the figure the author calls honest.
- Our own measurement runs, published with the raw numbers
- A step-zero run of 12 money queries times five identical repeats against one model on one day, 60 of 60 calls succeeded, 7 of 12 queries flipped outcome across the repeats, and a 20,000-split permutation test whose null difference centred on zero at a standard deviation of 0.215. Published method and figures on this site.
Questions about calculating AI share of voice
- How is AI share of voice calculated?
- It is your brand mentions divided by all brand mentions across a set of prompts sent to AI answer engines, written as a percentage. The formula is simple, so the number is decided by the denominator, which brands are in the set, whether non-brand entities are filtered, and how each prompt is weighted and repeated.
- Why do two tools report different AI share of voice numbers?
- Because they build the denominator differently. One may count non-brand entities, another may weight prompts by an adjusted volume base, and a third may run each prompt once rather than several times. The counting rarely differs. The set being counted, and how it is weighted and sampled, is where two correct tools disagree.
- Can AI share of voice reach 100%?
- Yes, and it is usually a warning rather than a win. A reading of 100% often means an empty competitor set was defined, so the denominator held nothing but your own brand. A share of an empty market is arithmetically real and tells you nothing about dominance, which is why the competitor set belongs beside every number.
- Should non-brand entities count in the denominator?
- No. A displayed list once showed a leading brand at 9.5% beside an ingredient at 4.6% and a regulator at 2.5%, which inflates the denominator with things no one competes against. Filtering entities down to actual brands before dividing is the first fix, and it raises every remaining share once the non-brands are removed.
- How many times should each prompt be run?
- More than once, because AI answers are not deterministic. In our own run, 7 of 12 queries flipped which brand was cited across five identical repeats on the same day. A single pass per prompt reports one draw from that spread as if it were stable, so repeating prompts and reporting the spread is what makes a trend readable.
- Does a rising AI share of voice prove our work caused it?
- Not on its own. The number can move because a tool changed its weighting base, because the model changed its own answers, or because of ordinary repeat variance. Separating your work from those causes needs a held-out set of queries left unworked over the same period, which no share-of-voice dashboard ships by default.
Keep reading
Measurement
Best AI Visibility Tools (and Where a Tool Alone Runs Out)
Seven AI-visibility tools compared on what they actually measure and what they cost, plus the one question none of them can answer on their own.
24 min read
Measurement
AirOps Alternatives: Content-AEO vs Pure Measurement
Nine real AirOps alternatives, split into content production and pure measurement, plus the buyer split most vendor comparison pages miss entirely.
25 min read
Measurement
Profound Alternatives: What Teams Actually Switch To (and Why)
Five real alternatives to Profound compared on what they track and what they cost, built from the actual switching threads where teams explain why they left.
23 min read