AI Citation Decay, Half-Life, and When a Drop Is Real
A competitor platform now tracks how long an AI citation survives. We checked the idea against our own volatility data. A single drop is not proof of decay.
Citon23 min read
Short answer
Do AI citations for a page decay over time, and does that mean content needs refreshing on a fixed schedule?
Yes and no. A page that gets cited by an AI engine typically rises to a peak and then fades, and a competitor AI-visibility platform now tracks that curve directly, reporting that half of all cited content is under 13 weeks old. That part is real and worth watching. What it does not tell you is whether one citation dropping between two reads is genuine decay or ordinary noise, because our own repeat testing found 7 of 12 identical queries changed answer between identical asks with nothing else different. A single before-and-after reading cannot tell decay from noise apart. A tracked curve across many reads, and a refresh timed to the window where updates actually move a page, can.
A competitor AI-visibility platform shipped a new feature this week called Citation Decay. It plots a citation curve for every URL an AI engine has ever cited: the week it was first cited, how many days it took to rise to a peak, how many weeks it held that peak, and how many days after the peak its weekly citation count fell to half of what it had been and stayed there. The headline number attached to the launch is blunt. Half of the content answer engines cite is under 13 weeks old. A citation is not a thing you earn once. It is a thing that starts fading the moment it peaks, for roughly half of everything currently being cited, inside a single financial quarter.
That is a genuinely useful thing to measure, and worth taking seriously on its own terms before getting to the part we think is missing. Most teams currently manage this by feel: check whether the page still shows up in an AI answer once a quarter, and if it does not, guess at why. A named metric with a defined start, a defined peak, and a defined half-life replaces that guess with a shape a team can actually plan around, and the launch of a product feature built specifically to track it is a signal the market has decided this is worth measuring formally rather than eyeballing.
This piece does two things. First, it walks through what a decay curve like this actually measures, because "citations decay" is a claim that sounds obvious once stated and turns out to have real structure underneath it, structure that changes what a content team should do about it. Second, it puts that curve next to a finding we have already published about our own measurement work, that a single reading of whether a page is cited by an AI engine is noisy enough to flip outcome across identical, back-to-back queries with nothing else changed. A citation curve smooths that noise into a clean weekly line. The smoothing is real and useful. It is also easy to forget it happened, which is where a team can end up treating an ordinary noisy dip as evidence their content went stale, spend a week rewriting a page that did not need it, and credit the rewrite when the number recovers on its own.
What a decay curve actually measures
The mechanics are worth walking through in full, because most of the value in a metric like this is in the definitions, not the headline stat. The curve starts at a page's first-cited date, the first week an answer engine cited the URL at all. From there it tracks weekly citation counts up to a peak, the highest weekly count the page reaches and the week it happened. The distance from first-cited to peak is the rise, measured in days. After the peak, the curve is tracked until weekly citations fall to half of the peak value and stay there, which is the half-life. A last-cited date closes out the record, the most recent week the page was still being cited at all, which is not the same thing as the citation count reaching zero. A page can plateau indefinitely above zero and never technically "finish" decaying. The whole series is smoothed on a two-week rolling average specifically so that one odd week, a single spike or a single dead week, does not register as a false signal in either direction.
At a glance
What a citation-decay curve actually measures
| Metric | What it tells you |
|---|---|
| First-cited date | The first week an answer engine cited the URL at all. Everything else on the curve is measured from this point. |
| Rise | Days from first-cited to peak weekly citation volume. A slow rise and a fast rise are different shapes, not just different speeds. |
| Peak | The highest weekly citation count the URL reached, and the week it happened. The ceiling the rest of the curve is measured against. |
| Half-life | Days from peak until weekly citations fall to half the peak and stay there. Short half-life after a long rise is the pattern to watch for. |
| Last-cited date | The most recent week the URL was still cited. Not the same as "decayed to zero," a page can plateau above zero indefinitely. |
The one worked example given alongside the launch is worth sitting with, because it is a genuinely counter-intuitive shape. A page rose for 63 days before reaching its peak, then had a 7-day half-life once it got there. Slow climb, fast collapse. That is a different pattern from a page that spikes to its peak in a week and then fades gradually over months, even though both pages might end up with the same total citations over their lifetime. A decay-curve metric that reported only "average citations over 90 days" would treat those two pages as identical. A metric that reports rise and half-life separately does not.
A page that rose for 63 days and then had a 7-day half-life climbed slowly then rapidly lost relevance. The shape of the curve is a different fact than how long the page has existed.
Stated as a lifecycle rather than a formula, the five stages run in a fixed order and each one answers a different operational question.
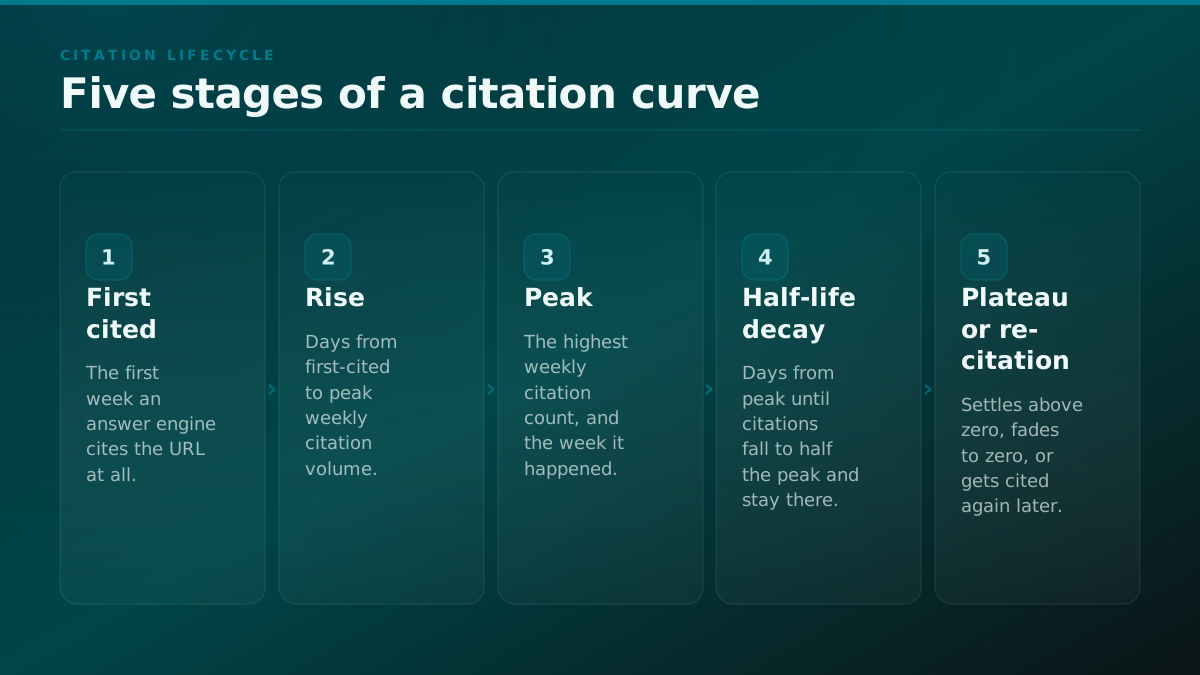
First-cited tells a team a page has cleared the bar of being retrievable and quotable at all, which is a different bar than ranking. Rise tells a team how much runway a page has before it needs anything done to it. Peak sets the ceiling everything after it gets compared against. Half-life is the number that should actually drive a refresh calendar, because it says how much time a team has before a page's citation count is cut in half. Plateau or re-citation is the stage a decay-curve metric alone cannot distinguish from a slow, permanent fade, without watching what happens next.
Why the curve looks different depending on which engine you ask
The published methodology tracks a curve per URL without breaking it out by which AI engine did the citing, which is a reasonable simplification for a first version of a metric like this and also the place where a second, real data point from elsewhere becomes useful. A separate 2-million-citation study found that the four major answer engines do not agree on how old cited content can be in the first place. Claude's median cited page is 5.1 months old, Google AI's is 6.0 months, Gemini's is 7.8 months, and ChatGPT's is 8.0 months, roughly 57 percent older than Claude's. We wrote about that finding in more depth in our earlier piece on AI citations, prediction versus proof, where the question was what predicts a citation in the first place rather than what happens to one after it exists. It is the same underlying dataset doing different work here.
Median age of cited content, by engine
| Engine | Median age of cited content |
|---|---|
| Claude | 5.1 months |
| Google AI | 6.0 months |
| Gemini | 7.8 months |
| ChatGPT | 8.0 months |
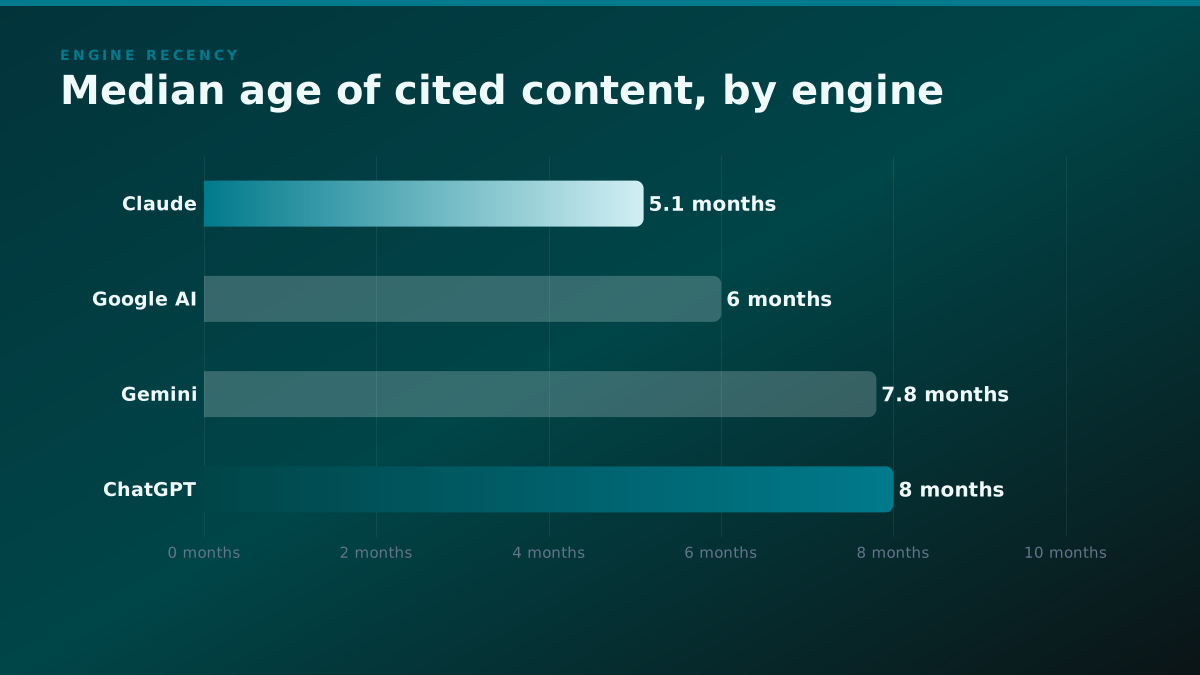
If the four engines disagree on the median age of a page they are willing to cite by close to three months, there is no reason to expect them to agree on how fast a citation decays after it peaks either. A blended, all-engine decay curve is the same averaging problem our earlier piece on why a single AI visibility score is noise raised about a blended visibility score: it reports a real number that describes no single engine's actual behavior particularly well. A page tuned to ChatGPT's apparent tolerance for older content and refreshed on that cadence will read as under-refreshed on Claude's faster-moving citation pool, and a single blended curve will not tell a team which engine is the one being under-served.
The same 2-million-citation dataset found a second divergence that should be expected to interact with decay rate as well, even though nobody has yet published a curve broken out this way. ChatGPT draws 39 percent of its unique cited URLs from brand-controlled domains, a company's own site talking about itself, while Gemini draws only 14 percent from the same category, leaning much harder on third-party and independent sources. A brand-owned page and an independent third-party page earning a citation on the same topic are not obviously subject to the same decay dynamics. A brand's own site has direct control over exactly the kind of substantive update that would extend a page's rise or slow its half-life, a paragraph added, a statistic refreshed, a section restructured around a question the model started asking about the topic. A third-party page an author does not control, a forum thread, a news article, a review site, is far more likely to fade on a fixed decay curve regardless of what the cited brand does, because nobody at the brand can walk in and update it. A single blended decay curve averaged across brand-owned and third-party citations is very likely averaging over two structurally different decay processes, not one, in the same way it averages over four engines with different recency preferences.
The refresh window that a real practitioner report points to
The theoretical answer to "when should a page be refreshed" is "right before its half-life expires," which is a clean rule that requires already having a decay curve for the page in question, a chicken-and-egg problem for anyone just starting to measure this. A real, if informal, field report from r/GEO_optimization gets closer to a practical answer. A practitioner froze new content production entirely for 30 days and instead updated 60 underperforming pages, refreshing dates, replacing stale statistics, and adding a paragraph or two addressing questions AI answers had started raising that the page did not yet cover. Across those 60 pages, citation rate rose from 8.7 percent to 10.7 percent, a 23 percent relative increase.
The part of that report worth taking more seriously than the headline number is which pages responded. It was not the newest pages, and it was not the oldest ones. Pages 3 to 6 months old, past their initial indexing period but before what the report calls the model's representation of them "hardened," responded within 5 to 7 days of being updated. Pages over 18 months old barely moved at all.
The window where updates matter most is the 3-to-6-month band, after the initial indexing honeymoon but before the model's representation hardens.
That maps cleanly onto the rise-and-half-life shape from the decay-curve methodology above, even though the report was written independently of it. A page inside its rise, or recently past its peak, is still elastic. Content posted into a page during that window has a real chance of extending the peak or slowing the descent into half-life. A page well past its half-life, sitting on a long plateau or a slow fade that has been running for over a year, is a different problem entirely, closer to re-launching a page than refreshing one. The honest caveat belongs here rather than being left implicit: this is one account, on one team's pages, not a controlled experiment, and it is reported in this post as a real, useful data point rather than as a proven rule. It is exactly the kind of finding a held-out control could confirm or reject, and as far as we can tell nobody, including the report's own author, has run that control yet.
Before calling a drop decay, rule out that it is noise
This is the part a decay-curve metric, however well built, cannot see from the outside, and it is the reason we are writing about this topic at all rather than leaving it to a company that sells the tracking dashboard. A citation curve is built by sampling a page's citation status on some cadence, weekly in the published methodology, and plotting the result. Each weekly sample is, underneath the smoothing, a single reading of whether an AI engine cites the page for a given query on a given day. Our own measurement work found that a single reading like that is a lot noisier than it looks. Twelve money queries, asked five times each against one model on one day, nothing changed between asks: 7 of the 12 flipped outcome, named in one run and absent in the next, with the same question asked minutes apart. A separate permutation test, 20,000 random splits of that same query set with no intervention applied to either half, produced a null difference centred on zero with a standard deviation of 0.215, the size of swing that should be expected between two readings of an untouched query purely from the system's own variability.
Seven of twelve identical queries changed their answer between identical repeats, with nothing else different. A citation curve built from single weekly reads is built on exactly that noise, smoothed but not removed.
A two-week rolling average, which the published methodology uses specifically to smooth out odd weeks, helps with exactly this problem and does not eliminate it. Averaging four weekly reads together reduces the chance that one noisy week gets mistaken for the start of a decline, but it does not distinguish "this page's true citation rate declined" from "this page's true citation rate stayed flat and the readings happened to run low for a few consecutive weeks," a pattern that 7-of-12 flip rates on a single day make entirely plausible over a four-week window. The practical difference between a single before-and-after reading and a reading checked against a measured noise floor is the difference between two very different claims a team can make about the same observed drop.
What a single reading proves, against what a repeat-sampled one proves
| Question | A single before-and-after read | A repeat-sampled, noise-floored read |
|---|---|---|
| Did the citation actually drop | Shows a drop, cannot rule out that the same query would have flipped back on a third ask | Compares the drop against a measured null distribution first |
| Is the drop the start of real decay | Assumes yes, has no baseline to check against | Checks whether the drop exceeds what 7 of 12 identical repeats already produces with nothing changed |
| Did a refresh cause a re-citation | Assumes yes if the citation returns, cannot rule out drift | Compares a refreshed page against an untouched control page over the same window |
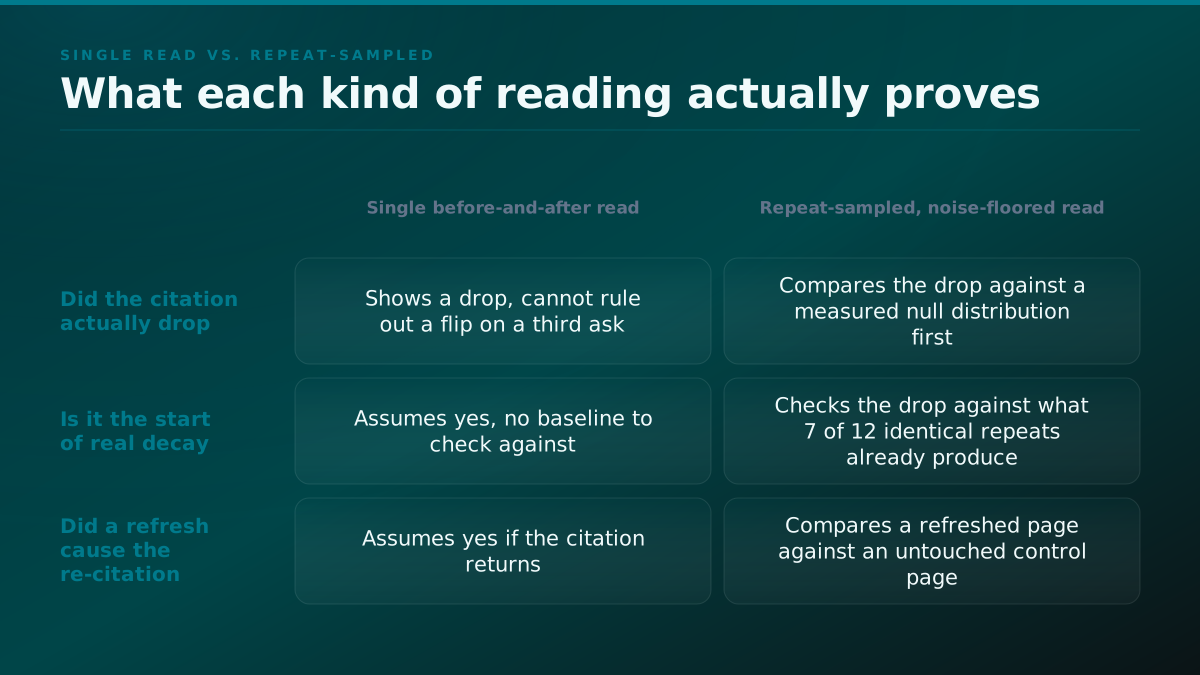
Put concretely: imagine a page's weekly citation count drops from 12 to 6 between two consecutive reads on a curve like this. Read against nothing, that looks exactly like the start of a half-life decline, and a team watching the dashboard would reasonably start planning a refresh. Read against our own permutation-test baseline, a swing of that size on a low-citation page is well inside the range 20,000 no-intervention splits already produced on a comparable query set. Neither reading is dishonest. They are answering two different questions: "did the number go down" and "did something real happen." A decay-curve tool answers the first one well. Answering the second one needs the same instrument measuring answer engine optimization lift was built for: a repeat-sampled baseline, established before anyone reads significance into a single week's number.
A second decay driver worth separating from staleness
Everything above treats decay as a single process with a single likely cause, the content itself getting stale relative to what a model has since learned about the topic. Our own ongoing analysis of citation behavior points to at least one more mechanism worth separating out before assuming a falling citation count means the page needs new words on it. A page's citation is not independent of its underlying search ranking. When a page loses meaningful organic ranking, in a core algorithm update, a competitor overtaking it, or a site-wide authority shift, we have observed citation loss tracking that ranking loss at a rate in the neighborhood of one fifth to one quarter of the affected pages, and it happens on a timeline that has nothing to do with how recently the content itself was edited. A page can be perfectly current, accurate, and well-written, and still lose its citation because the ranking signal an answer engine's retrieval step leans on moved out from under it.
That distinction matters for what a team does next. A page decaying because it went stale needs new substance, an updated statistic, a section covering a question the model has started asking that the page does not yet answer. A page decaying because it lost the ranking a retrieval system was leaning on needs different work entirely, the kind that addresses authority and ranking signal rather than content freshness, and no amount of rewriting the same page will fix a problem that originates outside it. Our own reading of repeated citation checks around ranking-affecting events consistently shows a faster, sharper drop than the gradual half-life decay a purely content-staleness model would predict, closer to a step change than a slope. A team watching only a smoothed, two-week-averaged decay curve would see the drop and reasonably reach for a content refresh. If the actual cause was a ranking shift, that refresh does nothing, the citation count keeps falling, and the natural conclusion drawn from the failed fix, "we refreshed it and it still decayed," would be wrong for a reason the curve itself never surfaced.
Separately, and consistent with the r/GEO_optimization report above, our own observation of pages that received a genuinely substantive update, not a date-stamp change, tends to show a real citation lift within roughly the first three months after the update ships, in some cases running close to double the pre-update citation rate on the queries the update was aimed at. The size of that lift varies enough by page and by query that we are not reporting it as a fixed multiplier here, and it carries the same caveat as the refresh-window finding above: without a held-out control on the specific page set in question, some portion of any observed lift could still be ordinary drift rather than the update's own effect. What we are confident of is the direction and the rough timing window, both of which line up with the elastic 3-to-6-month period the practitioner report identified independently.
What would actually prove a refresh worked
The refresh-window finding from r/GEO_optimization and the decay-curve methodology both stop one step short of the strongest possible claim, and it is worth naming that step precisely rather than implying either source already cleared it. Both describe a correlation: pages got refreshed, and citation counts moved. Neither includes a control group, a set of comparable pages left deliberately unrefreshed over the same window, to check whether the movement would have happened anyway. Google's own guidance on AI features is explicit that generative AI features run on the same core ranking and quality systems Search has used for two decades, systems that already reward non-commodity, actively maintained content over recycled or stale pages. That is a real, stated reason a refresh SHOULD help. It is not proof that a specific team's specific refresh caused a specific citation count to rise rather than drift on its own, and the report itself does not claim otherwise.
The design that would settle it is the same one behind our own two published runs, scaled up rather than reinvented. Take a set of pages inside the 3-to-6 month elastic window the refresh report identified. Split them into a treated group that gets refreshed and a held-out control group that does not, matched as closely as possible on age, topic and prior citation rate. Measure both groups on the same weekly cadence a decay curve already uses, repeat-sampled rather than single-read, for long enough to establish a noise floor on this specific query set the way our 20,000-split permutation test did on ours. If the treated group's citation rate rises measurably more than the control group's over that window, the refresh caused it. If the two groups move together, the refresh coincided with something else, most likely the same baseline drift a repeat-sampled read would have caught on its own. That is a bigger, slower experiment than reading a decay curve or trying a 30-day refresh sprint once, and it is the one design that actually answers the causal question either of those two leaves open.
It is also a genuinely harder experiment to run than either of the two shortcuts, and naming that cost honestly is part of stating the design accurately. Matching pages on age, topic and prior citation rate closely enough that a treated-versus-control comparison means anything takes real selection work up front, more than picking whichever pages happen to be underperforming this month. Holding a control group deliberately unrefreshed for months, while competitors' pages on the same topics keep shipping updates, is a real opportunity cost a team has to accept on purpose rather than one that shows up by accident. And the whole design only produces a clean answer if the repeat-sampling and noise-floor work from the section above is already running underneath it, because a treated group that "rose" against a control group that also rose, both moving inside the same permutation-test noise band, is not a result at all, it is two noisy readings that happened to land on the same side of zero. The design is correct. It is not free, and a team weighing whether to run it should weigh that against what a wrong refresh decision, made off a single noisy reading, actually costs in wasted content-team time over a year of decisions like it.
A lightweight version of this, without a dedicated tracking tool
Not every team is ready to buy a per-URL decay-curve product, and the version below is what the same discipline looks like run by hand on a spreadsheet, which is closer to what most teams actually have time for.
Start with the pages that already carry the most citations, the ones with something to lose, rather than trying to track everything at once. For each one, ask the same four questions the decay-curve methodology tracks formally: when did it first get cited on the queries that matter, has it peaked yet or is it still rising, and if it has peaked, how long ago. Check each page against the same query set on a fixed cadence, weekly is what the published methodology uses and is a reasonable default, but the exact interval matters less than keeping it fixed and running the same query wording every time. Wording drift between checks is its own confound, on top of the noise this piece has already described.
Before reading anything into a single week's result, run the check two or three times in the same sitting, the same way our own step-zero run asked twelve queries five times each rather than once. A citation that shows up in one of three identical asks and not the other two is not evidence of decay. It is evidence of exactly the volatility this piece has been describing, and it is cheap to catch at the point of measurement rather than after a team has already reacted to it. Log a real drop only once it holds across a repeated check, then treat pages in the 3-to-6-month band as the priority queue for a substantive update rather than a date-stamp change, per the practitioner finding above, and treat anything showing a sharp, step-like drop rather than a gradual fade as a ranking-loss candidate worth checking against search performance data before assuming the content itself needs work.
What to ask before trusting any citation-decay dashboard
None of the questions below are aimed at any specific product, including any we build ourselves. They are the questions worth asking of any tool, ours or anyone else's, that reports a citation number moving over time, because the answers determine whether a reported drop or rise is telling a team something real.
How many times is each query actually asked before a weekly data point gets recorded. A single ask per query per week carries close to no information about what an answer engine does on average that week, for the same reason our own five-repeat step-zero run found 7 of 12 outcomes flipping on identical asks. A tool that samples once and reports it as the week's citation status is reporting one draw from a noisy distribution as if it were the distribution's mean.
Is a noise floor disclosed anywhere, for this specific query set, on this specific engine. A standard deviation of 0.215 on a 12-query permutation test is not a universal constant; it is specific to that query set, that model, and that day, and a different vertical or a different engine would produce a different number. A dashboard that reports a percentage-point change with no stated noise floor is asking a buyer to trust that any movement shown is signal, without ever having measured what movement looks like when nothing real happened.
Does the tool distinguish a gradual half-life fade from a sharp, step-like drop. The two look identical on a line chart smoothed with a two-week rolling average unless the underlying data is inspected at finer resolution, and they point to different causes and different fixes, content staleness in one case and a ranking-driven citation loss in the other, per the mechanism described above.
Is the curve broken out by engine, or is it a single blended line. A blended curve, as the recency and brand-controlled-citation figures above both show, is averaging over engines and content-ownership categories that behave differently enough that a blended number can move in a direction none of the individual engines actually moved in.
None of these questions are a reason to distrust the concept of tracking a citation curve, which is a real improvement over checking once a quarter and guessing. They are the difference between a tool that reports a level and a tool that reports a level next to the noise it would need to clear before that level means anything, the same distinction this entire piece has been drawing between a single reading and a repeat-sampled one.
Reading a decay curve without over-reading it
None of this is an argument against tracking a citation curve. First-cited, rise, peak and half-life are a real, useful vocabulary for a problem most teams currently manage by feel, checking whether a page shows up in an answer once a quarter and drawing conclusions from whatever they see that day. A page's half-life is a genuinely better trigger for a refresh than a fixed calendar interval applied uniformly across a site, because a fixed interval optimizes for whichever engine's decay rate happens to be slowest and quietly under-serves every faster one, the same failure mode the engine-level recency numbers above describe from a different angle.
The argument is narrower than "don't trust the metric." It is that a single weekly reading, however cleanly it gets plotted on a curve, inherits the same noise our own repeat testing found in a single before-and-after check, and a two-week rolling average smooths that noise without removing the question it raises. Before treating a citation drop as the start of real decay, and before crediting a refresh with reversing one, the same discipline applies that we have argued for our other reporting on AI-citation measurement: read more than once, know what the baseline noise looks like for the specific query set in question, and where the stakes are high enough, hold out a control group rather than trusting a single line on a chart. Our pricing reflects that this is the work we actually bill, sizing a repeat-sampled baseline against a client's own query set before either of us calls a citation change real, not a subscription to a dashboard that reports the same single-read number back on a nicer chart.
A team that reads this far has one honest question worth carrying into the next dashboard they check: was that drop measured once, or measured enough times to know what a drop looks like when nothing actually changed. If the answer is "once," the number on the screen is a data point, not a finding, whichever side of the curve it happens to be sitting on.
None of this is a case against the concept a competitor just shipped a product feature for. First-cited, rise, peak and half-life are a real, useful improvement over the status quo most teams are working from, which is no vocabulary at all and a quarterly gut check. The case is narrower and, we think, more useful than either "trust the curve" or "distrust the curve." A citation curve tells a team what happened. It does not, on its own, tell a team why, and the two most common reasons a citation actually falls, the content going stale and the underlying ranking slipping, call for different fixes that a smoothed weekly line cannot tell apart without a second look. A team that pairs the vocabulary this metric introduces with a repeat-sampled read before acting on any single number is doing something meaningfully different from a team that reacts to the first dip it sees on a chart, even though both teams would describe themselves as tracking citation decay.
The practical consequence for anyone buying this work is a timeline question, and it has two separate answers rather than one: how long answer engine optimization takes to work separates the speed at which citations rotate from the much slower business of proving the movement was yours. And the volume instinct a falling curve tends to provoke, publish more to compensate, is worth checking before acting on: does publishing more content actually get you cited by AI walks through what our own citation split says about that trade.
Sources
Every number above, and where it came from. A figure without a row here is one we should not have printed.
- A competitor AI-visibility platform, "Citation Decay" feature announcement
- Published product feature tracking a citation curve per URL, first-cited date, rise duration, peak weekly citations, half-life, and last-cited date, on a two-week rolling average. Reports that half of all AI-engine-cited content is under 13 weeks old, and gives one worked example of a page that rose for 63 days before a 7-day half-life.
- Our own step-zero measurement run
- 12 money queries times 5 identical repeats, one model, one day, 60 of 60 calls succeeded, 7 of 12 flipped outcome between identical repeats. Published with its numbers on this site.
- Our own permutation test
- 20,000 random splits of the same query set with no intervention applied. Null difference centred on zero, mean +/-0.0016, standard deviation 0.215.
- DiscoveredLabs, "What Drives AI Citations"
- 2 million AI citation observations over 6 months across ChatGPT, Claude, Google AI and Gemini. Median cited-content age varies by engine, Claude 5.1 months, Google AI 6.0 months, Gemini 7.8 months, ChatGPT 8.0 months.
- r/GEO_optimization, "I stopped writing new content for 30 days and just updated old posts, AI citations went up 23%"
- 9 upvotes, 21 comments, 2026-07-23. A practitioner refreshed 60 underperforming pages instead of publishing new ones and reports citation rate rising from 8.7% to 10.7%, with the strongest response coming from pages 3 to 6 months old rather than the newest or oldest ones. Single account, not a controlled study, stated as such in this post.
- Gagan Ghotra, reaction to a citation-decay feature announcement
- 10 likes, 907 views, 2026-08-16. An independent SEO and AI-search consultant flags the announcement to peers and asks what they think of it, evidence the concept is new enough that practitioners are still forming a view rather than treating it as settled.
- Google Search Central, optimizing your website for generative AI features
- Google's own guidance. States that generative AI features on Search are rooted in core Search ranking and quality systems and that content should be non-commodity rather than recycled, the closest Google comes to a public freshness stance for AI-cited content.
Questions this answers
- What is AI citation decay?
- The pattern where a page's weekly citation count by an AI engine rises to a peak after first being cited, then falls off over time, sometimes settling at a lower plateau and sometimes fading to zero. A published feature now tracks this per URL directly.
- How is a citation half-life defined?
- The number of days from a page's peak weekly citation count until that count falls to half the peak and stays there. A short half-life after a long, slow rise is a different pattern than a short half-life after a fast spike.
- How old is content that AI engines typically cite?
- Under 13 weeks old for half of all cited content, per a published citation-decay feature. Separately, median cited-content age varies by engine, from 5.1 months on Claude to 8.0 months on ChatGPT, so "how old" depends heavily on which engine is being measured.
- When should a page be refreshed to stay cited?
- One practitioner's own tracking found the strongest response came from pages 3 to 6 months old, not the newest or oldest ones, with citation rate rising 23% across 60 refreshed pages within about a week. That is one account, not a controlled study, reported as a data point rather than a settled rule.
- Does a citation dropping between two checks always mean real decay?
- No. Our own repeat testing found 7 of 12 identical queries changed answer between identical asks on the same day, with nothing else different, and a permutation test on the same query set produced a null swing with a standard deviation of 0.215. A single before-and-after reading cannot separate genuine decay from that same baseline noise.
- What would actually prove a refresh caused a page to be re-cited?
- A held-out control, a set of comparable pages left deliberately unrefreshed across the same window, checked against the refreshed pages at the end. If the untouched pages moved by a similar amount, the refresh was not the cause. Neither a decay curve nor a single before-and-after reading includes that comparison on its own.
Keep reading
AI citations
LLM SEO, what it actually is and what the work looks like
Google says its AI features run on the same ranking systems as Search, so the tactics are familiar. What changed is how you tell whether the work landed.
46 min read
AI citations
Best AI SEO Agency for Developer Tools and API Companies
A five-question checklist for vetting an AI SEO agency, built from what real developer-tool buyers report going wrong, not a ranked vendor list.
24 min read
AI citations
Does Google index Reddit comments? What actually counts
Reddit's robots.txt disallows every crawler, yet Google shows Reddit with full descriptions. Here is what is actually indexed, measured rather than assumed.
25 min read